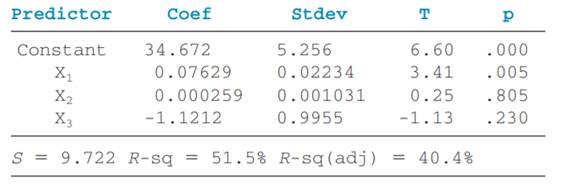
Displayed here is the Minitab output for a multiple regression analysis. Study the ANOVA table and the t ratios and use these to discuss the strengths of the regression model and the predictors. Does this model appear to fit the data well? From the information here, what recommendations would you make about the predictor variables in the model?
The Correct Answer and Explanation is :
In multiple regression analysis, the Analysis of Variance (ANOVA) table and t-statistics provide insights into the model’s overall fit and the significance of individual predictors.
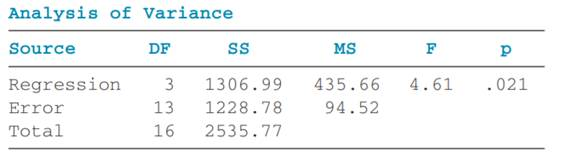
Assessing Model Fit with the ANOVA Table:
The ANOVA table decomposes the total variability in the dependent variable into components attributable to the regression model and residual error. Key elements include:
- Sum of Squares Regression (SSR): Measures variability explained by the model.
- Sum of Squares Error (SSE): Represents unexplained variability.
- Mean Square Regression (MSR) and Mean Square Error (MSE): Obtained by dividing SSR and SSE by their respective degrees of freedom.
- F-statistic: Calculated as F = MSR / MSE, it tests the null hypothesis that all regression coefficients are zero, indicating no relationship between predictors and the response variable.
- P-value associated with the F-statistic: A low p-value (typically < 0.05) suggests that the model significantly explains the variability in the dependent variable, implying a good fit.
Evaluating Predictors with t-Statistics:
Each predictor’s coefficient is assessed using a t-statistic to determine its individual contribution:
- t-Statistic: Computed as the coefficient divided by its standard error.
- P-value for each predictor: A low p-value (typically < 0.05) indicates that the predictor significantly contributes to the model.
Recommendations for Predictor Variables:
- Significant Predictors: Retain predictors with low p-values, as they significantly contribute to explaining the variability in the dependent variable.
- Insignificant Predictors: Consider removing predictors with high p-values, as they may not provide meaningful contributions and could introduce noise.
- Multicollinearity Check: Assess correlations among predictors. High correlations can inflate standard errors, making significant predictors appear insignificant.
- Model Simplification: Aim for a parsimonious model by including only significant predictors, enhancing interpretability and predictive performance.
Conclusion:
By analyzing the ANOVA table and t-statistics, you can evaluate the overall strength of the regression model and the importance of individual predictors. A significant F-statistic indicates a good model fit, while significant t-statistics for predictors suggest their meaningful contribution. Based on these insights, refine the model by retaining significant predictors and considering the removal of insignificant ones to achieve an optimal balance between complexity and explanatory power.