The diagram below represents a titration curve of glycine; glycine’s carboxyl group has a pka = 2.34 and its amino group has a pka = 9.60. 13 At what point on the diagram is glycine Glycine present predominantly as the species pk 2 = 9.60 below?
(A) When pH < 1.34=””>
(B) When pH is between 3.34 and 8.60
(C) When pH > 10.60
(D) Glycine stays as this form at all pH levels.
(E) Glycine is never found in this form.
pH pl = 5.97 pk, = 2.34 H ਆਨ- H2N-C-H 1 2 0.5 1.5 OH- (equivalents) COO-

The Correct Answer and Explanation is :
The correct answer is (C) When pH > 10.60.
Glycine, the simplest amino acid, contains two ionizable groups: a carboxyl group with a pKa of 2.34 and an amino group with a pKa of 9.60. The ionization state of glycine varies with pH, influencing its overall charge and structure.
At low pH values (below 2.34), both the carboxyl and amino groups are protonated, resulting in the cationic form: NH₃⁺-CH₂-COOH. As the pH increases and surpasses the first pKa (2.34), the carboxyl group deprotonates, leading to the zwitterionic form: NH₃⁺-CH₂-COO⁻. This zwitterion predominates between pH 2.34 and 9.60.
When the pH exceeds the second pKa (9.60), the amino group deprotonates, forming the anionic species: NH₂-CH₂-COO⁻. This deprotonation is significant because it imparts a net negative charge to the molecule. To ensure that glycine exists predominantly in this anionic form, the pH should be at least one unit higher than the pKa of the amino group. Therefore, at pH values greater than 10.60, glycine is mainly present as NH₂-CH₂-COO⁻.
Understanding the pH-dependent ionization states of glycine is crucial in biochemistry, as it affects protein structure, enzyme activity, and amino acid behavior in different environments.
Below is a visual representation of the titration curve of glycine, illustrating the regions where different ionic forms predominate:
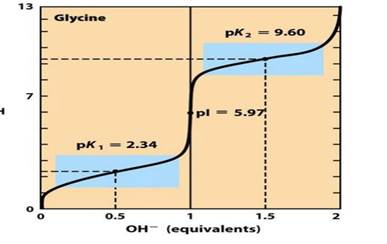
In this diagram, the x-axis represents the pH, and the y-axis represents the degree of deprotonation. The curve shows the transitions between the cationic, zwitterionic, and anionic forms of glycine as the pH increases.