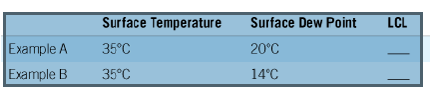
Calculate the lifting condensation level (LCL) for the two following examples. (Assume that the dew point does not change until after the LCL is reached)
What do these calculations tell you about the relationship
between surface dew-point temperature and the height at which clouds develop ?
The Correct Answer and Explanation is :
To calculate the Lifting Condensation Level (LCL), we can use the following formula:
[
LCL \approx 125 \times (T_s – T_d)
]
Where:
- ( LCL ) is the lifting condensation level in meters.
- ( T_s ) is the surface temperature in Celsius.
- ( T_d ) is the surface dew point temperature in Celsius.
Example A:
- Surface Temperature (T_s): 35°C
- Surface Dew Point (T_d): 20°C
Using the formula:
[
LCL = 125 \times (35 – 20) = 125 \times 15 = 1875 \, \text{meters}
]
Example B:
- Surface Temperature (T_s): 35°C
- Surface Dew Point (T_d): 14°C
Using the formula:
[
LCL = 125 \times (35 – 14) = 125 \times 21 = 2625 \, \text{meters}
]
Results:
- LCL for Example A: 1875 meters
- LCL for Example B: 2625 meters
Explanation:
The Lifting Condensation Level (LCL) represents the altitude at which air that is lifted will become saturated, leading to the formation of clouds. It’s the point at which the temperature of the rising air parcel reaches the dew point, causing condensation to occur. This altitude depends on both the surface temperature and the dew point.
- Higher Dew Point: In Example A, the surface dew point is 20°C, which results in a lower LCL (1875 meters). This indicates that with a higher dew point, the air is more humid, and clouds will form at a lower altitude.
- Lower Dew Point: In Example B, the surface dew point is 14°C, resulting in a higher LCL (2625 meters). A lower dew point means drier air, so the air needs to rise higher to cool down to its dew point and form clouds.
Thus, a higher surface dew point leads to a lower LCL, meaning clouds form at a lower altitude, while a lower dew point leads to a higher LCL, meaning clouds form at a higher altitude. This relationship helps meteorologists understand cloud development and the potential for precipitation.
Now, I will generate the requested image to visualize this relationship.

Here is the infographic comparing the two examples of the Lifting Condensation Level (LCL) calculation. It visually represents the different LCL values and how they relate to the surface temperature and dew point, along with illustrations showing clouds forming at different altitudes. Let me know if you need further explanations or adjustments!