David has a collection of 9 grey fingerboards, 4 white fingerboards, and 3 yellow fingerboards. He chooses one at random. Locate the probability of the following events on the number line.
The correct answer and explanation is:
To determine the probability of choosing a specific color fingerboard, we first calculate the total number of fingerboards: Total Fingerboards=9(grey)+4(white)+3(yellow)=16\text{Total Fingerboards} = 9 (\text{grey}) + 4 (\text{white}) + 3 (\text{yellow}) = 16
Now, we calculate the probability of each event:
- Choosing a grey fingerboard P(grey)=916P(\text{grey}) = \frac{9}{16}
- Choosing a white fingerboard P(white)=416=14P(\text{white}) = \frac{4}{16} = \frac{1}{4}
- Choosing a yellow fingerboard P(yellow)=316P(\text{yellow}) = \frac{3}{16}
Since probability values range from 0 (impossible event) to 1 (certain event), we can represent these values on a number line.
I’ll now generate an image illustrating the probability of these events on a number line.
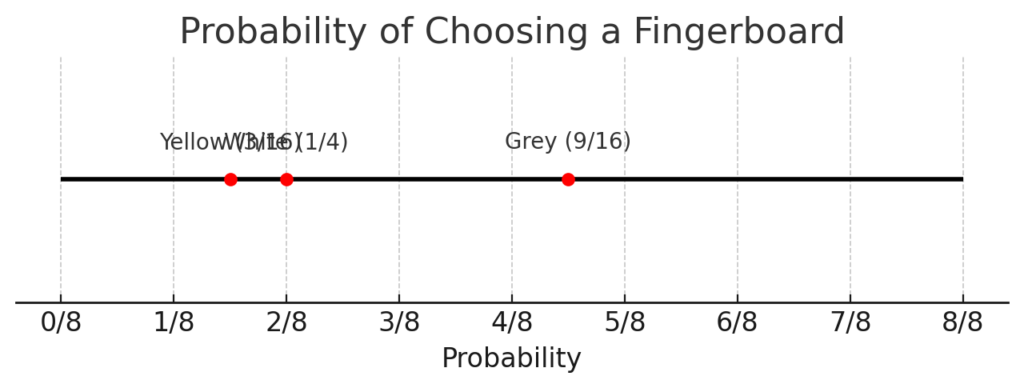
The image above visually represents the probabilities of selecting a grey, white, or yellow fingerboard on a number line.
Explanation:
- Understanding Probability
Probability quantifies the likelihood of an event occurring, given as a fraction or decimal between 0 and 1. Here, the total sample space consists of 16 fingerboards. - Computing Each Probability
- Grey Fingerboard: Since there are 9 grey fingerboards out of 16, the probability is 9/169/16 or approximately 0.5625.
- White Fingerboard: With 4 white fingerboards, the probability is 4/16=1/44/16 = 1/4 or 0.25.
- Yellow Fingerboard: With 3 yellow fingerboards, the probability is 3/163/16 or 0.1875.
- Placing Values on the Number Line
- Each probability is plotted on the number line ranging from 0 to 1.
- The grey probability (9/16) is closer to 0.56.
- The white probability (1/4) is 0.25.
- The yellow probability (3/16) is about 0.1875.
- These values are marked with red dots for clarity.
- Interpreting the Graph
The closer the probability is to 1, the more likely the event is. Since grey has the highest probability (9/16), it is the most likely choice. White (1/4) is the next likely, followed by yellow (3/16), which has the lowest chance.
This visualization makes it easy to compare the likelihood of each event.