Draw a typical climate diagram for a tropical rainforest. Label all parts of the diagram and describe all of the types of information an ecologist could glean from such a diagram.
The correct answer and explanation is :
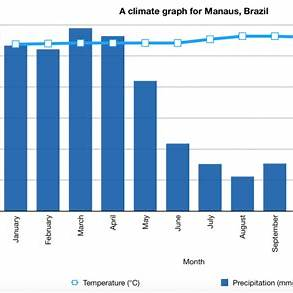
A climate diagram, or climatograph, is a graphical representation that displays the average temperature and precipitation of a specific region over the course of a year. For a tropical rainforest, such a diagram typically showcases consistently high temperatures and substantial, year-round rainfall.
Components of the Diagram:
- X-Axis (Horizontal): Represents the months of the year, from January to December, indicating the temporal progression.
- Primary Y-Axis (Left Vertical): Denotes average monthly precipitation, measured in millimeters (mm).
- Secondary Y-Axis (Right Vertical): Indicates average monthly temperature, measured in degrees Celsius (°C).
- Bar Graph: Depicts monthly precipitation levels, with each bar’s height corresponding to the amount of rainfall received in that month.
- Line Graph: Illustrates the average monthly temperature, connecting data points to show temperature trends throughout the year.
Information Gleaned by Ecologists:
- Temperature Consistency: Tropical rainforests maintain stable, warm temperatures year-round, typically averaging between 25°C to 28°C. This minimal temperature variation supports a diverse range of flora and fauna.
- High Precipitation: Annual rainfall in these regions often exceeds 2,000 mm, with no distinct dry season. This abundant moisture fosters lush vegetation and intricate ecosystems.
- Biodiversity Indicators: The stable climate conditions contribute to high biodiversity. Ecologists can infer the presence of complex food webs and numerous ecological niches.
- Soil Nutrient Dynamics: Despite heavy rainfall, tropical rainforest soils are often nutrient-poor due to leaching. The rapid decomposition rates, driven by warm and moist conditions, result in a thin layer of organic matter, necessitating efficient nutrient cycling among organisms.
- Ecosystem Productivity: The combination of warmth and moisture leads to high primary productivity, meaning plants grow rapidly, supporting diverse animal populations.
- Climate Resilience: Understanding the consistent climate patterns helps ecologists assess the resilience of these ecosystems to external disturbances, such as deforestation or climate change.
In summary, a climate diagram for a tropical rainforest reveals a consistently warm and wet environment, underpinning the rich biodiversity and complex ecological processes characteristic of these vital ecosystems.