A. Write the ratio 1.45 to 4.35 as a simplified fraction. Provide our answer below
B. The null and alternative hypotheses for a test are given, as well as some information about the actual sample and the statistic that is computed for each randomization sample. Indicate where the randomization distribution will be centered. Sample: 12.7,22.2 Randomization statistic: -2
The correct answer and explanation is :
Part A: Ratio Simplification
We are asked to simplify the ratio ( 1.45 : 4.35 ).
First, express the ratio as a fraction:
[
\frac{1.45}{4.35}
]
To simplify this, we eliminate the decimals by multiplying both the numerator and denominator by 100 (this shifts the decimal point two places to the right):
[
\frac{1.45 \times 100}{4.35 \times 100} = \frac{145}{435}
]
Now, simplify the fraction by finding the greatest common divisor (GCD) of 145 and 435. The GCD of 145 and 435 is 145. We divide both the numerator and denominator by 145:
[
\frac{145}{435} = \frac{145 \div 145}{435 \div 145} = \frac{1}{3}
]
Thus, the simplified ratio of 1.45 to 4.35 is:
[
\boxed{\frac{1}{3}}
]
Part B: Randomization Distribution Center
In hypothesis testing, the randomization distribution is a distribution of a test statistic that is created by resampling or randomization methods. For the given problem, you are asked to identify where the randomization distribution will be centered.
Null and Alternative Hypotheses
The null hypothesis (( H_0 )) represents the idea that there is no effect or no difference, while the alternative hypothesis (( H_A )) represents the idea that there is an effect or difference. Based on the problem, we are given:
- Sample: ( 12.7, 22.2 )
- Randomization Statistic: ( -2 )
While the null and alternative hypotheses are not explicitly stated in the problem, a typical hypothesis test might look something like this:
- ( H_0: \mu = 0 ) (no difference between the groups)
- ( H_A: \mu \neq 0 ) (there is a difference)
Randomization Statistic
The randomization statistic provided is ( -2 ), which is the statistic computed for each randomization sample. This statistic represents the observed difference (or effect) between the sample groups under the null hypothesis.
Centering of the Randomization Distribution
The randomization distribution is centered around the value of the statistic under the null hypothesis. In this case, the center of the randomization distribution will correspond to the expected value of the test statistic assuming the null hypothesis is true. If the null hypothesis states that there is no difference between the groups (i.e., ( \mu = 0 )), the randomization distribution will be centered around zero.
Thus, the randomization distribution will be centered at 0 if the null hypothesis is true. If the randomization statistic of ( -2 ) is far from 0, this might suggest that the observed result is unlikely under the null hypothesis, providing evidence in favor of the alternative hypothesis.
Conclusion
The randomization distribution will be centered around ( 0 ) based on the assumption that the null hypothesis is true. The statistic ( -2 ) indicates how far the observed sample statistic is from the null hypothesis value.
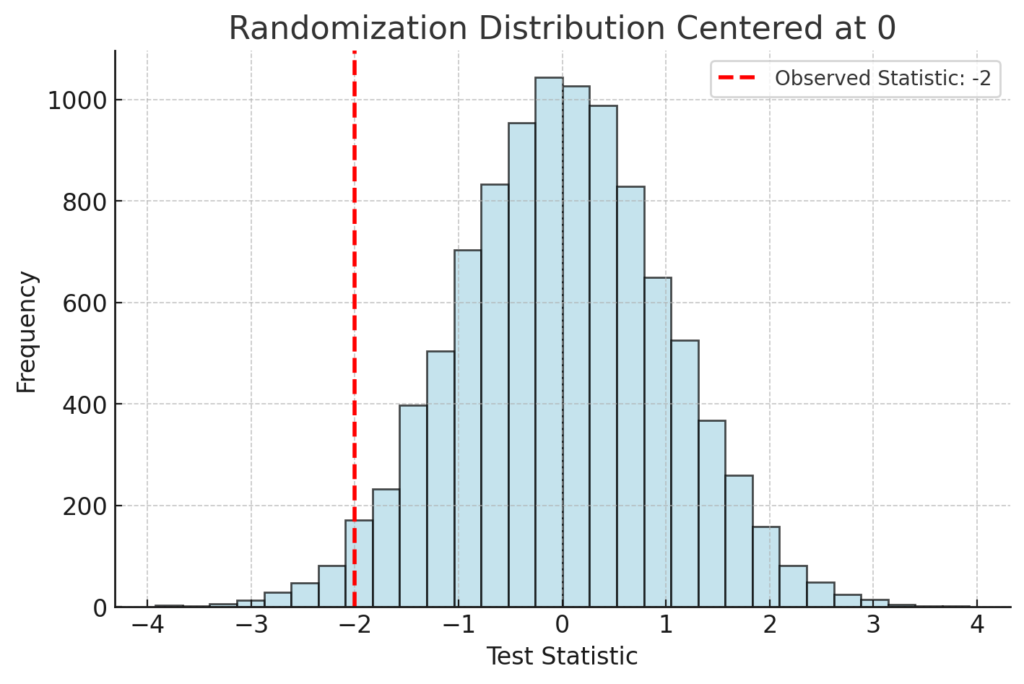
Here is the visual representation of the randomization distribution centered at 0, with the observed statistic of -2 marked in red. The center of the randomization distribution corresponds to the value of the test statistic under the null hypothesis (0), while the observed statistic indicates how far the actual sample statistic is from this value.
This helps to understand whether the observed statistic is typical under the null hypothesis or if it suggests evidence for the alternative hypothesis.