Which of the following represent measures of variability (or dispersion)?
Standard deviation and range
Median and mode
Standard deviation and mean
Variance and mean
The correct answer and explanation is :
The correct answer is:
✅ Standard deviation and range
Explanation:
Measures of variability (or dispersion) describe how spread out the data points are in a dataset. The most common measures of variability include range, variance, and standard deviation.
1. Standard Deviation
- Standard deviation measures how much individual data points deviate from the mean.
- A higher standard deviation means that the data points are more spread out, while a lower standard deviation means they are closer to the mean.
- It is calculated as the square root of variance.
2. Range
- The range is the simplest measure of dispersion.
- It is calculated as the difference between the maximum and minimum values in the dataset.
- A larger range indicates greater variability, while a smaller range suggests that the data points are closer together.
Why the Other Options Are Incorrect:
❌ Median and Mode
- These are measures of central tendency, not variability.
- The median represents the middle value, while the mode represents the most frequently occurring value.
❌ Standard Deviation and Mean
- The standard deviation is a measure of dispersion, but the mean is a measure of central tendency.
- The mean alone does not describe how spread out the data is.
❌ Variance and Mean
- Variance is a measure of variability, but the mean is not.
- Variance shows how data points differ from the mean in squared units, but mean only represents the average.
Visualization:
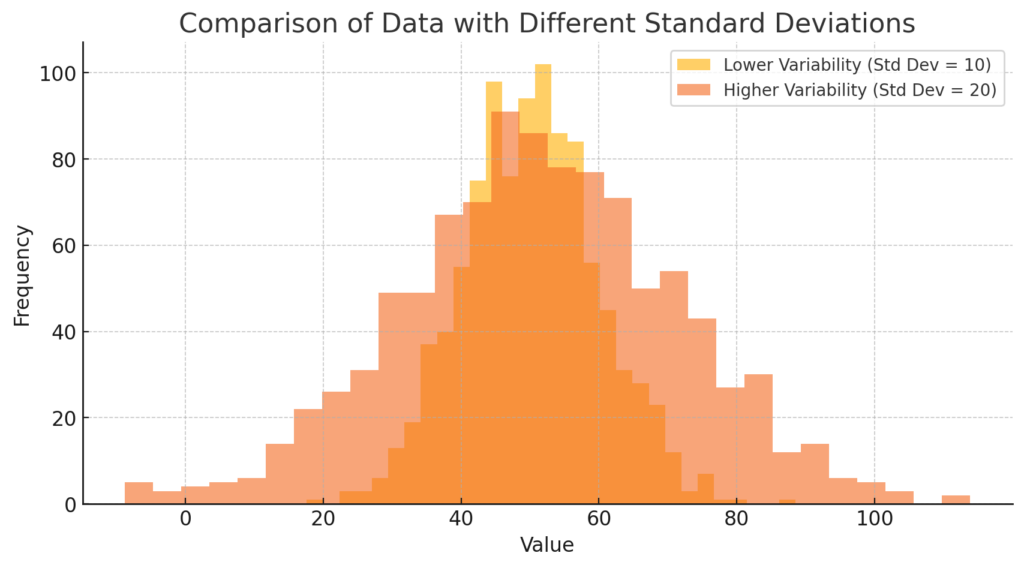
The image above visually represents two datasets with the same mean but different standard deviations. The dataset with a higher standard deviation (20) is more spread out, while the one with a lower standard deviation (10) is more concentrated around the mean.