Find the percentile for the observed value in the following situations:
a. Quantitative reasoning GRE score of 146 (mean 5 151.3, s. d. 5 8.7).
b. Stanford-Binet IQ score of 97 (mean 5 100, s. d. 5 15).
c. Woman’s height of 68 inches (mean 5 65 inches, s. d. 5 2.5 inches).
d. Man’s height of 68 inches (mean = 70 inches, s. d. = 3 inches).
The correct answer and explanation is :
To determine the percentile rank of an observed value within a normally distributed dataset, we can follow these steps:
- Calculate the Z-score: This standardizes the observed value relative to the dataset’s mean and standard deviation.
- Convert the Z-score to a percentile: This indicates the percentage of data points below the observed value.
The Z-score is calculated using the formula:
[ Z = \frac{X – \mu}{\sigma} ]
Where:
- ( X ) = observed value
- ( \mu ) = mean of the dataset
- ( \sigma ) = standard deviation of the dataset
Let’s apply this to each scenario:
a. Quantitative reasoning GRE score of 146 (mean = 151.3, s.d. = 8.7):
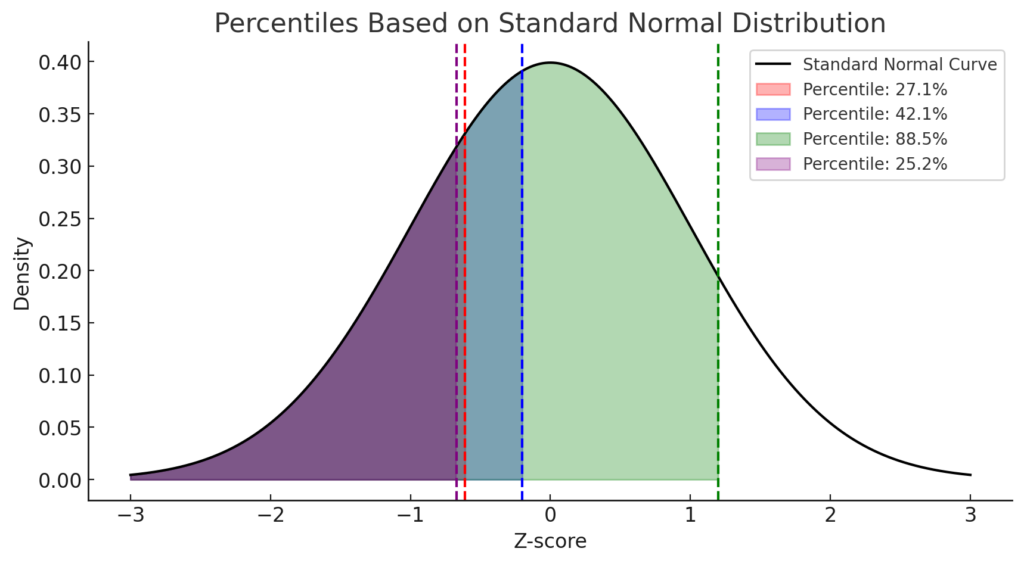
[ Z = \frac{146 – 151.3}{8.7} \approx -0.61 ]
A Z-score of -0.61 corresponds to approximately the 27th percentile, meaning the score is higher than about 27% of test-takers.
b. Stanford-Binet IQ score of 97 (mean = 100, s.d. = 15):
[ Z = \frac{97 – 100}{15} \approx -0.20 ]
A Z-score of -0.20 corresponds to approximately the 42nd percentile, indicating the score is higher than about 42% of individuals.
c. Woman’s height of 68 inches (mean = 65 inches, s.d. = 2.5 inches):
[ Z = \frac{68 – 65}{2.5} \approx 1.20 ]
A Z-score of 1.20 corresponds to approximately the 88th percentile, suggesting the height is greater than about 88% of women.
d. Man’s height of 68 inches (mean = 70 inches, s.d. = 3 inches):
[ Z = \frac{68 – 70}{3} \approx -0.67 ]
A Z-score of -0.67 corresponds to approximately the 25th percentile, indicating the height is taller than about 25% of men.
Explanation:
Z-scores are a statistical measurement that describe a value’s relation to the mean of a group of values, expressed in terms of standard deviations. A Z-score of 0 indicates the value is exactly at the mean, positive Z-scores indicate values above the mean, and negative Z-scores indicate values below the mean.
By converting Z-scores to percentiles, we can understand the relative standing of an individual data point within a distribution. Percentiles represent the percentage of scores in a distribution that a particular score is higher than. For instance, a score at the 88th percentile is higher than 88% of the scores in the distribution.
To find the percentile corresponding to a Z-score, one can use a Z-score to percentile table or an online calculator. These tools provide the cumulative percentage of values below a given Z-score in a standard normal distribution.
Understanding these concepts is particularly useful in standardized testing, psychological assessments, and anthropometric measurements, as it allows for the comparison of individual scores to a broader population.