The Correct Answer and Explanation is:
✅ Correct Answer:
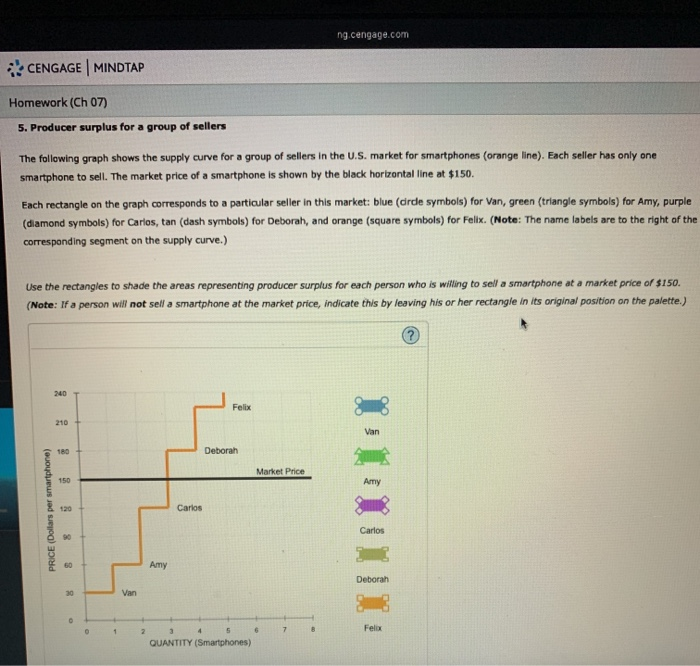
At the market price of $150, only sellers whose cost is less than or equal to $150 will be willing to sell. So, we must identify sellers whose cost is below $150 (to gain surplus) and shade the producer surplus area — the difference between $150 and their cost.
From the graph:
| Seller | Price (Cost) | Will Sell? | Producer Surplus ($150 – Cost) |
|---|---|---|---|
| Van | $30 | Yes | $120 |
| Amy | $90 | Yes | $60 |
| Carlos | $120 | Yes | $30 |
| Deborah | $180 | No | $0 |
| Felix | $240 | No | $0 |
Only Van, Amy, and Carlos will sell at the market price of $150. Deborah and Felix will not sell because their costs exceed the market price.
Shade the following rectangles to represent producer surplus:
- Van: From cost $30 to price $150 → surplus = $120
- Amy: From $90 to $150 → surplus = $60
- Carlos: From $120 to $150 → surplus = $30
Leave Deborah and Felix in their original positions (do not shade them).
📘 Explanation
Producer surplus is the difference between what a seller is paid for a good (the market price) and the minimum amount the seller is willing to accept (their cost). Graphically, producer surplus is the area between the market price and the seller’s cost, represented by a rectangle for each seller in this case.
The given graph shows a stepwise supply curve for six sellers (Van, Amy, Carlos, Deborah, Felix), each offering one smartphone. The horizontal black line at $150 indicates the current market price.
To determine who sells, we compare each seller’s minimum acceptable price (cost) with the market price:
- Sellers whose cost is less than or equal to the market price will choose to sell.
- Those with costs above $150 will not participate since selling would result in a loss.
In this case, Van ($30), Amy ($90), and Carlos ($120) are all below the market price and thus will sell, earning a surplus. Van earns the most surplus ($150 – $30 = $120), followed by Amy ($60), and Carlos ($30). Deborah and Felix, with costs of $180 and $240 respectively, would incur losses and hence won’t sell.
To complete the graph as instructed, only shade the rectangles for Van, Amy, and Carlos — the shaded portion should represent the area between each of their costs and the $150 market price. Leave the rectangles for Deborah and Felix unshaded, indicating they are not participating in the market at this price.
This accurately represents the producer surplus distribution among the sellers at the current market price.