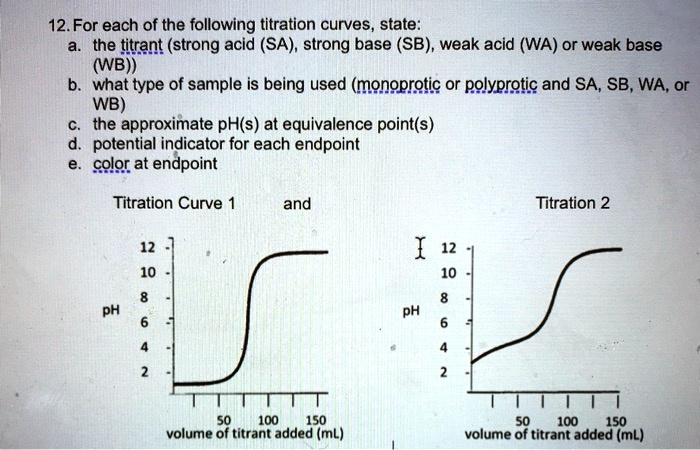
. For each of the following titration curves, state: the titrant (strong acid (SA), strong base (SB), weak acid (WA) or weak base (WB)), what type of sample is being used (monoprotic or polyprotic and SA, SB, WA, or WB), the approximate pH(s) at equivalence point(s), potential indicator for each endpoint, and color at endpoint. Titration Curve and Titration 2 pH 100 150 100 150 volume of titrant added (mL) volume of titrant added (mL)
The Correct Answer and Explanation is:
| Curve | Titrant | Sample in the flask | Mono- / Poly- protic | pH at equivalence | Suitable indicator* | Colour at end-point (with that indicator) |
|---|---|---|---|---|---|---|
| 1 | Strong base (SB) – e.g. NaOH | Strong acid (SA) – e.g. HCl | Monoprotic | ≈ 7.0 | Bromothymol blue (pH 6.0-7.6) or Phenolphthalein (pH 8.2-10) | BTB: green → blue / Phenolphthalein: colourless → faint pink |
| 2 | Strong base (SB) – e.g. NaOH | Weak acid (WA) – e.g. CH₃COOH | Monoprotic | ≈ 8.8-9.0 | Phenolphthalein (pH 8.2-10) | colourless → pale pink |
*Any indicator whose colour change range lies inside the steep vertical part of the curve is acceptable; the ones listed are the most commonly used choices.
Why these answers are correct
Shape of the curves.
Both titrations start at low pH and finish in the basic region, so the titrant must be a base added from the burette.
Curve 1 begins around pH 2 and is flat until the sudden, very sharp jump that centres on pH ≈ 7, giving a perfectly symmetrical S-shape. Such behaviour is typical when a strong acid is neutralised by a strong base: before the equivalence point the pH is governed solely by excess H₃O⁺, and after it by excess OH⁻, giving an almost vertical 6-unit rise that straddles neutrality.
Curve 2 starts higher, close to pH 4, rises slowly, then has a broader, less steep section whose midpoint is above 7 (≈ 9). This is exactly what is expected when a weak acid is titrated with a strong base: before equivalence the pH is buffered by the HA/A⁻ pair, and at the equivalence point the only species present is the weak-base conjugate A⁻, so the solution is basic.
Number of inflection points.
Only one inflection is visible for each curve, implying that both samples are monoprotic; a diprotic/polyprotic species would show two or more distinct vertical jumps.
Equivalence-point pH.
Strong-acid/strong-base titrations end almost exactly at pH 7 because neither ion hydrolyses appreciably.
Weak-acid/strong-base systems end above 7 because the conjugate base is a weak base (Kb = Kw/Ka), pushing the equilibrium basic.
Indicator choice.
An indicator must change colour within the steep part of the curve:
Curve 1: the vertical span runs roughly 4 → 10, so any indicator whose transition includes pH 7 works. Bromothymol blue is ideal (yellow-green-blue 6.0-7.6) and phenolphthalein also works as its faint pink appears just after equivalence.
Curve 2: the vertical span is about 7.5 → 10.5, so phenolphthalein (8.2-10) is the classic choice; bromothymol blue would turn too early.
The reported colours correspond to those indicators’ standard acid/base forms, giving an unambiguous visual end-point for each titration.
