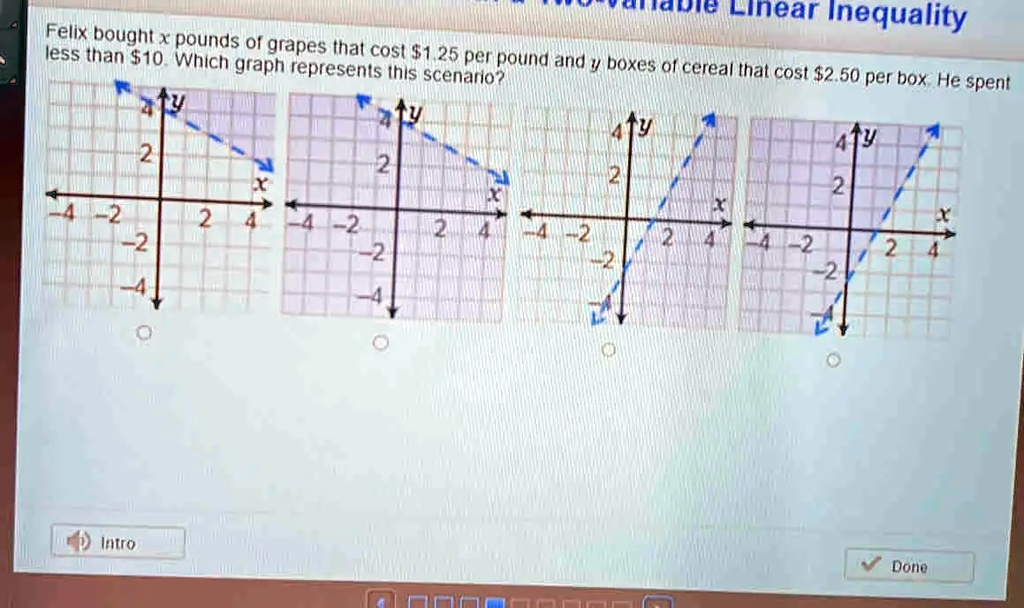
Linear Inequality Felix bought x pounds of grapes that cost $1.25 per pound and y boxes of cereal that cost $2.50 per box. He spent less than $10. Which graph represents this scenario?
Linear Inequality Felix bought x pounds of grapes that cost
2.50 per box. He spent less than $10. Which graph represents this scenario?
The Correct Answer and Explanation is:
To solve the problem, let’s first turn the word problem into a mathematical inequality:
Given:
- xx: pounds of grapes at $1.25 per pound
- yy: boxes of cereal at $2.50 per box
- Felix spent less than $10
Step 1: Create the inequality
The total cost of grapes and cereal must be less than $10: 1.25x+2.5y<101.25x + 2.5y < 10
Step 2: Convert to slope-intercept form
To graph it, solve for yy: 1.25x+2.5y<101.25x + 2.5y < 10
Subtract 1.25×1.25x from both sides: 2.5y<−1.25x+102.5y < -1.25x + 10
Divide all terms by 2.5: y<−0.5x+4y < -0.5x + 4
This is the inequality we are graphing.
Step 3: Analyze the Graphs
We are looking for:
- A dashed line (because the inequality is strictly less than)
- A shaded region below the line (because it’s less than, not greater)
- The line should have a slope of -0.5 and y-intercept of 4
Step 4: Identify the Correct Graph
Looking at the 4 graph options:
- The second graph from the left (Graph 2) shows:
- A dashed line (correct)
- Line has a negative slope (correct)
- Line crosses y-axis at 4 (correct)
- Shaded below the line (correct)
✅ Correct Answer: The second graph from the left.
Final Explanation
To determine the correct graph for the scenario, we begin by translating the situation into a mathematical inequality. Felix buys xx pounds of grapes at $1.25 per pound and yy boxes of cereal at $2.50 per box. Since his total spending is less than $10, we write the inequality:
1.25x+2.5y<101.25x + 2.5y < 10
To graph this, we rearrange it into slope-intercept form. Subtracting 1.25×1.25x from both sides and then dividing every term by 2.5 gives:
y<−0.5x+4y < -0.5x + 4
This equation tells us that the graph should have a line with slope -0.5 and y-intercept 4. Since the inequality is strictly less than (“<”), the line should be dashed, indicating that points on the line are not included in the solution. The shading should be below the line, representing all combinations of xx and yy where the total cost is less than $10.
By examining the four graphs, we find that the second graph from the left perfectly matches this description. It shows a dashed line with a negative slope intersecting the y-axis at 4, and the region below the line is shaded, indicating all values of xx and yy that satisfy the inequality.
Thus, the second graph from the left is the correct representation of the situation described.
