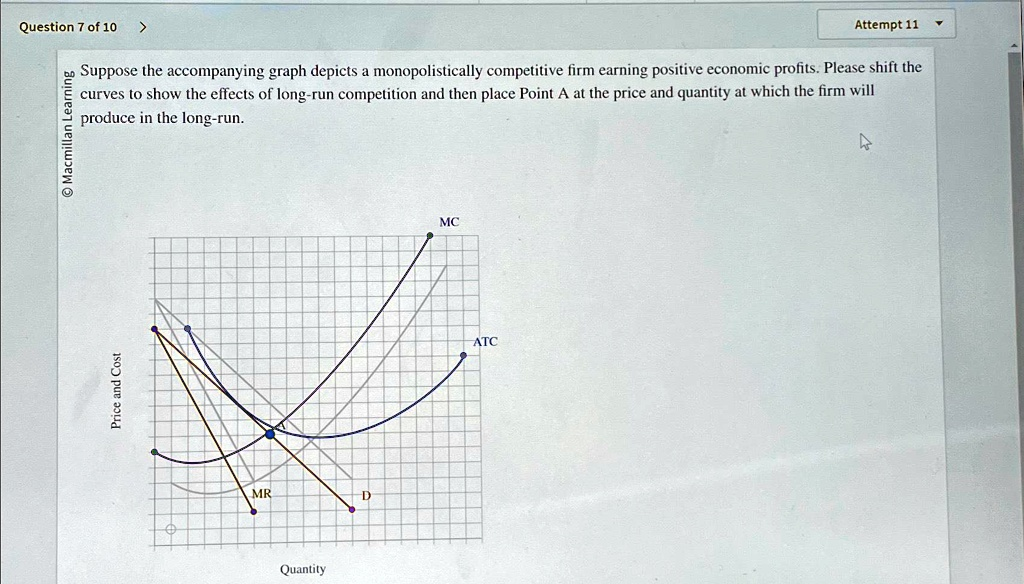
Question 7 of 10 no Suppose the accompanying graph depicts a monopolistically competitive firm earning positive economic profits. Please shift the curves to show the effects of long-run competition and then place Point A at the price and quantity at which the firm will produce in the long-run. Quantity Question 7of10 Attempt 11 Suppose the accompanying graph depicts a monopolistically competitive firm earning positive economic profits. Please shift the curves to show the effects of long-run competition and then place Point A at the price and quantity at which the firm will produce in the long-run. Macmillan MC ATC Price and Cost MR Quantity
The Correct Answer and Explanation is:
Correct Answer (Graph Explanation):
In the long run, for a monopolistically competitive firm, positive economic profits attract new entrants to the market. This increased competition causes:
- Demand (D) curve to shift left (due to loss of some customers to new firms).
- Marginal Revenue (MR) curve to also shift left, remaining below the new demand curve.
- The firm adjusts production until Price (P) = Average Total Cost (ATC), meaning zero economic profit.
In the graph, you should:
- Shift the Demand (D) and MR curves leftward.
- Keep the MC and ATC curves in the same position (they represent cost structure, which doesn’t change).
- Identify the point where the new MR curve intersects the MC curve (profit-maximizing quantity).
- From that quantity, go up to the new Demand (D) curve to find the price.
- The price must equal ATC at that quantity to reflect zero profit.
- Mark this point as “Point A”.
Explanation:
In the short run, a monopolistically competitive firm can earn positive economic profits because it has some market power due to product differentiation. This is shown in the original graph where the price (determined by the demand curve) is above the Average Total Cost (ATC) at the profit-maximizing output where Marginal Cost (MC) intersects Marginal Revenue (MR).
However, in the long run, economic profits attract new firms into the market because there are low barriers to entry. As more firms enter, the existing firm’s share of market demand declines, shifting its Demand (D) and Marginal Revenue (MR) curves to the left. This reflects fewer customers and less pricing power for the firm.
This process continues until the firm’s economic profit is zero, which occurs when the price (from the demand curve) equals the Average Total Cost (ATC) at the quantity where MR = MC. At this point, the firm still maximizes profit (minimizes loss) by producing where MR = MC, but earns only a normal profit—no incentive for further entry or exit exists.
Therefore, in the long run:
- Demand and MR curves shift left.
- Price equals ATC.
- Firm produces less output than in the short run.
- Firm remains in the market but earns zero economic profit.
On the graph, you place Point A at the intersection of the new Demand curve and ATC, directly above the MR = MC quantity. This represents long-run equilibrium.