Examine the graph of Gibbs energy (G) plotted against the course of the reaction (ΔG) below: For which of the indicated points is the reaction in equilibrium? (3) ΔG ΔG A B E D Course of Reaction None of the points A, E, and C A and B E and D
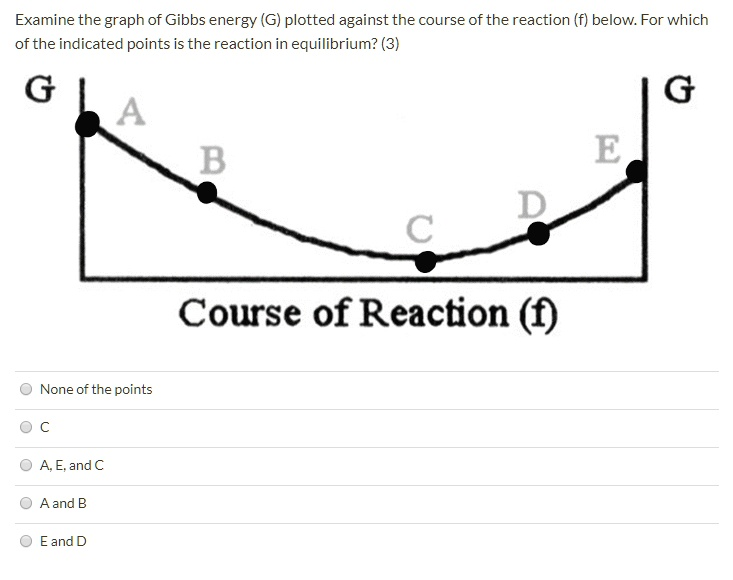
The correct answer is C.
Explanation:
This graph illustrates the relationship between the total Gibbs free energy (G) of a reaction mixture and the course of the reaction, which represents the extent to which reactants have been converted into products. The state of chemical equilibrium is a fundamental concept in thermodynamics, defined as the point where the system is most stable and has no tendency to change further.
- Gibbs Free Energy and Spontaneity: The Gibbs free energy (G) of a system is a measure of its total energy available to do useful work. A chemical reaction will proceed spontaneously in the direction that leads to a decrease in the system’s Gibbs free energy. The change in Gibbs free energy for a small extent of reaction is represented by the slope of this curve.
- Analyzing the Graph:
- Points A and B: These points are on the left side of the curve, where the reaction mixture is rich in reactants. The curve has a negative slope in this region. This means that as the reaction proceeds forward (from left to right), the total Gibbs free energy (G) of the system decreases. A decrease in G signifies a spontaneous process. Therefore, at points A and B, the forward reaction is spontaneous, and the system will continue to convert reactants into products to reach a lower energy state.
- Points D and E: These points are on the right side of the curve, where the reaction mixture is rich in products. Here, the curve has a positive slope. This indicates that for the reaction to proceed further in the forward direction, the Gibbs free energy would have to increase, which is a non-spontaneous process. Instead, the reverse reaction (converting products back to reactants) is spontaneous, as this would lead to a decrease in G.
- Point C: This point represents the very bottom of the curve, the minimum value of Gibbs free energy for the system. At this point, the slope of the curve is zero. This means that there is no change in Gibbs free energy (ΔG = 0) whether the reaction proceeds slightly forward or slightly backward. The system has reached its most stable state and has no net tendency to change in either direction. This is the definition of chemical equilibrium. At equilibrium, the rate of the forward reaction is exactly equal to the rate of the reverse reaction.
In summary, a system always seeks to minimize its Gibbs free energy. The process will spontaneously move “downhill” on the graph from either the reactant side (A, B) or the product side (E, D) until it settles at the lowest energy point, which is the equilibrium state represented by point C.