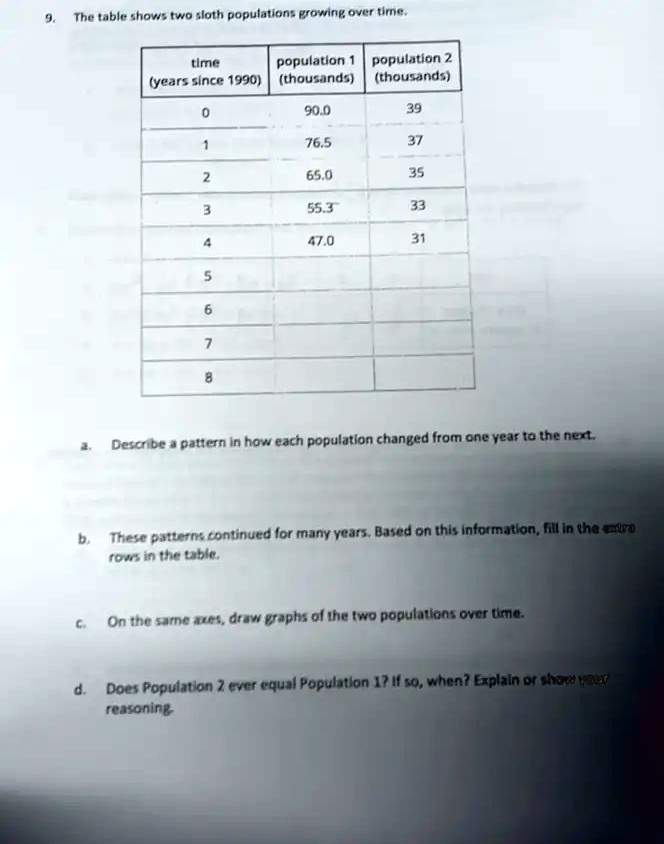
The table shows two sloth populations growing over time. time population 1 population 2 (years since 1990) (thousands) (thousands) 0 90.0 39 1 76.5 37 2 65.0 35 3 55.3 33 4 47.0 31 5 6 7 8 a. Describe a pattern in how each population changed from one year to the next. b. These patterns continued for many years. Based on this information, fill in the extra rows in the table. c. On the same axes, draw graphs of the two populations over time. d. Does Population 2 ever equal Population 1? If so, when? Explain or show your reasoning.
The Correct Answer and Explanation is:
a. Describe a pattern in how each population changed from one year to the next.
- Population 1: This population shows a pattern of exponential decay. Each year, the population is approximately 85% of the population from the previous year. We can see this by dividing a year’s population by the previous year’s population (e.g., 76.5 ÷ 90.0 = 0.85; 65.0 ÷ 76.5 ≈ 0.85). This means the population is decreasing by 15% each year.
- Population 2: This population shows a pattern of linear decay. It decreases by a constant amount of 2 thousand sloths each year (e.g., 39 – 2 = 37; 37 – 2 = 35).
b. These patterns continued for many years. Based on this information, fill in the extra rows in the table.
Using the patterns identified in part a, we can complete the table.
- For Population 1, we multiply the previous year’s value by 0.85.
- For Population 2, we subtract 2 from the previous year’s value.
| time (years since 1990) | population 1 (thousands) | population 2 (thousands) |
| 0 | 90.0 | 39 |
| 1 | 76.5 | 37 |
| 2 | 65.0 | 35 |
| 3 | 55.3 | 33 |
| 4 | 47.0 | 31 |
| 5 | 39.9 | 29 |
| 6 | 33.9 | 27 |
| 7 | 28.9 | 25 |
| 8 | 24.5 | 23 |
(Calculations for Population 1 are rounded to one decimal place, e.g., 47.0 × 0.85 = 39.95 ≈ 39.9)
c. On the same axes, draw graphs of the two populations over time.
The graph would show “Time (years since 1990)” on the x-axis and “Population (thousands)” on the y-axis.
- Graph of Population 1: This graph would be a downward-sloping curve. It starts at (0, 90) and decreases sharply at first, then becomes less steep over time, which is characteristic of exponential decay.
- Graph of Population 2: This graph would be a straight line that slopes downward. It starts at (0, 39) and decreases at a constant rate, passing through points like (4, 31) and (8, 23).

d. Does Population 2 ever equal Population 1? If so, when? Explain or show your reasoning.
Yes, Population 2 will eventually equal Population 1.
Reasoning:
We can determine this by continuing the pattern from the table for one more year.
- At year 8:
- Population 1 is 24.5 thousand.
- Population 2 is 23 thousand.
- At this point, Population 1 is still larger than Population 2.
- Let’s calculate for year 9:
- Population 1: 24.5 × 0.85 ≈ 20.8 thousand.
- Population 2: 23 – 2 = 21 thousand.
- At this point, Population 2 is now larger than Population 1.
Since Population 1 was larger at year 8 and Population 2 was larger at year 9, the two populations must have been equal at some point in time between year 8 and year 9 (i.e., sometime during the year 1998).