? Year in College Freshman Relative Frequency Frequency 600 30 Sophomore 560 28 Junior 22 Senior 400 20 Select one: 0 A 440 B. 520 C 220 D. 480
The Correct Answer and Explanation is:
To find the missing frequency for “Junior” in the table, we need to understand how relative frequency works. Relative frequency is the ratio of the frequency of a category to the total frequency of all categories combined.
The table provides:
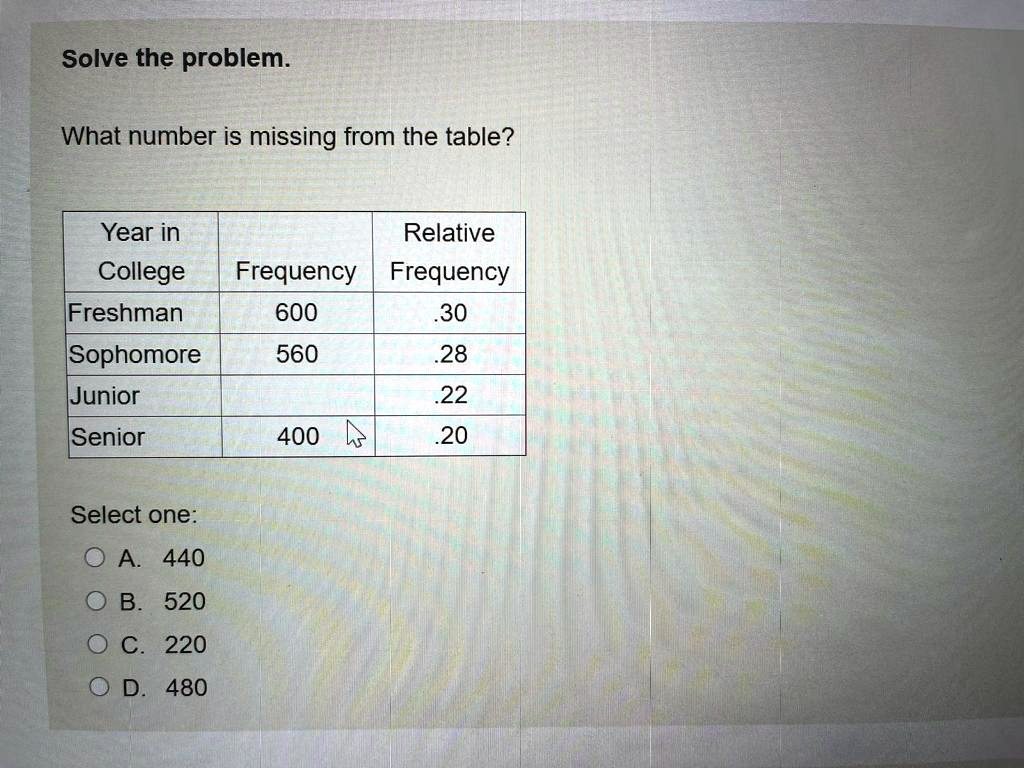
- Freshman: Frequency = 600, Relative Frequency = 0.30
- Sophomore: Frequency = 560, Relative Frequency = 0.28
- Junior: Frequency = ?, Relative Frequency = 0.22
- Senior: Frequency = 400, Relative Frequency = 0.20
Step 1: Use relative frequencies to find the total number of students
Since relative frequencies represent parts of a whole, the sum of all relative frequencies must be 1.00:
0.30 + 0.28 + 0.22 + 0.20 = 1.00
This confirms the table is consistent.
Let the total number of students be T. Then:
- Freshman: 600 = 0.30 * T
- Solve for T:
T=6000.30=2000T = \frac{600}{0.30} = 2000T=0.30600=2000
Step 2: Use total to find missing frequency
We now know the total number of students is 2000.
To find the Junior frequency, use its relative frequency:Junior Frequency=0.22∗2000=440\text{Junior Frequency} = 0.22 * 2000 = 440Junior Frequency=0.22∗2000=440
Final Answer:
A. 440
Explanation (300 words):
In statistics, a frequency table is used to organize data into categories along with the number of times each category occurs. When a table includes both frequency and relative frequency, the relative frequency helps compare different groups by showing their proportion relative to the total.
This problem involves determining the missing frequency for the “Junior” category using its given relative frequency. The key to solving this is recognizing that relative frequency is calculated as the frequency of a category divided by the total number of observations. Hence, if we know any one pair of frequency and relative frequency, we can calculate the total.
From the table, the Freshman row gives a frequency of 600 and a relative frequency of 0.30. Using this, we calculate the total student population as 600 divided by 0.30, which equals 2000. This total is consistent with the other given relative frequencies, because 0.28 + 0.22 + 0.20 + 0.30 equals 1.00.
Next, we apply this total to find the missing value. For Juniors, the relative frequency is 0.22, so multiplying that by 2000 gives 440. This means 440 juniors are in the data set.
This method ensures the relative proportions align with actual counts, and it confirms that all values are correctly scaled. Thus, understanding how relative frequencies relate to totals is crucial for solving problems like this. The correct answer is 440.