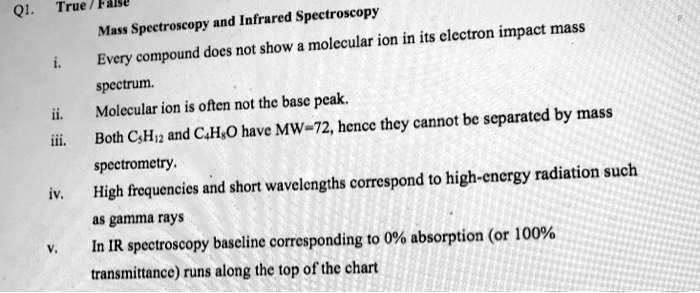
True/False Mass Spectroscopy and Infrared Spectroscopy i. Every compound does not show a molecular ion in its electron impact mass spectrum. ii. Molecular ion is often not the base peak. iii. Both
and
have MW=72, hence they cannot be separated by mass spectrometry. iv. High frequencies and short wavelengths correspond to high-energy radiation such as gamma rays v. In IR spectroscopy baseline corresponding to 0% absorption (or 100% transmittance) runs along the top of the chart
The Correct Answer and Explanation is:
Here are the correct answers:
i. True ii. True iii. False iv. True v. True
Explanation
i. Every compound does not show a molecular ion in its electron impact mass spectrum – This is true because electron impact ionization is a high-energy process that often fragments molecules. Some compounds form unstable molecular ions that break apart before detection, making their presence in the spectrum uncertain.
ii. Molecular ion is often not the base peak – This is true as well. The base peak is the most intense peak, representing the most abundant ion detected. Fragmentation frequently leads to smaller, more stable ions that dominate the spectrum, making the molecular ion peak comparatively weaker.
iii. Both C₅H₁₂ and C₄H₈O have MW = 72, hence they cannot be separated by mass spectrometry – This is false because mass spectrometry differentiates compounds not just by their molecular weight but also by their fragmentation patterns and isotope distributions. These properties allow mass spectrometry to distinguish between molecules even if their molecular weight is identical.
iv. High frequencies and short wavelengths correspond to high-energy radiation such as gamma rays – This is true since electromagnetic radiation follows the inverse relationship between wavelength and energy. Gamma rays possess extremely short wavelengths and high frequencies, placing them at the highest energy end of the spectrum.
v. In IR spectroscopy, the baseline corresponding to 0% absorption (or 100% transmittance) runs along the top of the chart – This is true because the infrared spectrum plots transmittance vertically, with 100% transmittance at the top, indicating no absorption, while absorption peaks dip downward where molecules absorb specific wavelengths of infrared radiation.
This breakdown enhances understanding of mass spectrometry and IR spectroscopy, highlighting key principles in molecular analysis.