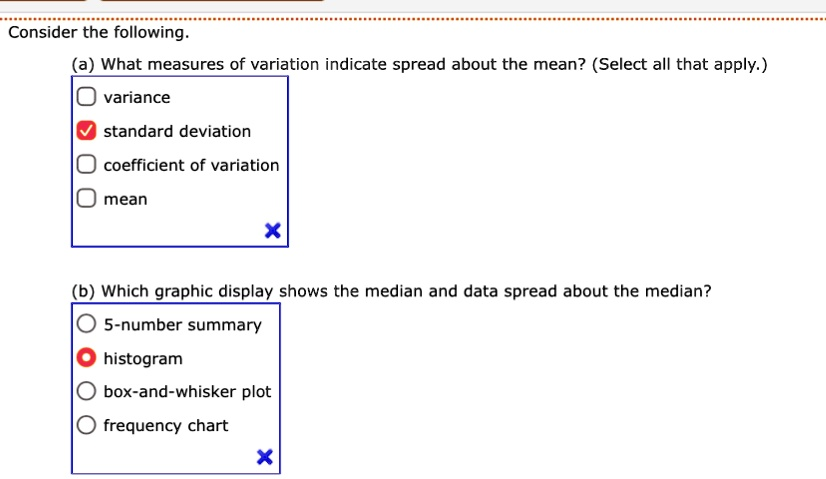
Consider the following. (a) What measures of variation indicate spread about the mean? (Select all that apply.) variance standard deviation coefficient of variation mean (b) Which graphic display shows the median and data spread about the median? 5-number summary histogram box-and-whisker plot frequency chart
The Correct Answer and Explanation is:
For part (a), the correct measures of variation that indicate the spread about the mean are variance, standard deviation, and coefficient of variation. The mean itself is not a measure of variation; it represents the central tendency of a data set rather than its dispersion.
Variance quantifies the average squared deviations from the mean, making it a fundamental measure of statistical dispersion. It provides insight into how spread out data points are within a distribution. Standard deviation, which is the square root of variance, expresses this spread in the same units as the original data, making it more interpretable. The coefficient of variation further refines this understanding by measuring relative dispersion. It is expressed as a percentage, representing the ratio of the standard deviation to the mean, which allows comparisons across different scales of measurement.
For part (b), the correct graphic display that shows both the median and data spread about the median is the box-and-whisker plot. This type of plot visualizes the distribution of data using five key summary statistics: minimum, first quartile, median, third quartile, and maximum. The box captures the interquartile range, which contains the middle 50 percent of the data, while the whiskers extend to the minimum and maximum values, showing the overall spread. Outliers, if present, are often plotted separately. Unlike histograms and frequency charts, which depict data distributions without emphasizing the median, box plots are specifically designed to highlight the central tendency and variability. The five-number summary provides numerical insights, but the box-and-whisker plot offers a visual representation that allows easier interpretation of the data’s spread and symmetry. By comparing different box plots, analysts can quickly assess variations in distributions across multiple data sets.