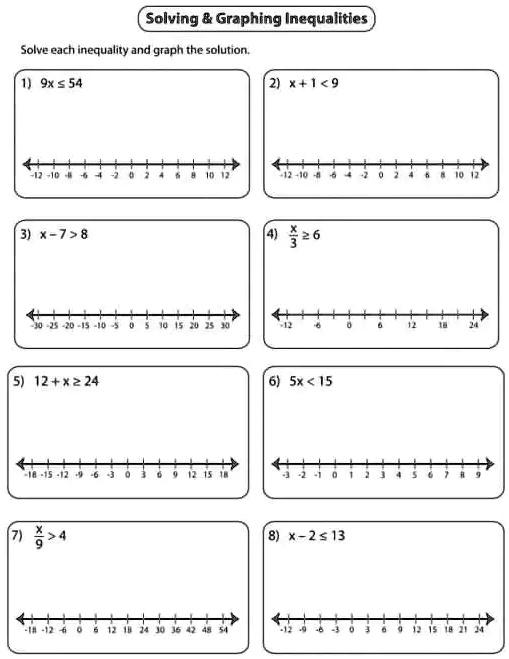
Solving & Graphing Inequalities Solve each inequality and graph the solution. 1) 9x ? 54 2) x+1<9 3) x-7>8 4) \frac{x}{3} ? 6 5) 12+x?24 6) 5x < 15 7) \frac{x}{9} > 4 8) x-2?13
Let’s go through each inequality one by one and solve them. After solving, I’ll explain how to graph each solution.
- 9x ≤ 54
- Divide both sides by 9:
- x ≤ 6
- Graph: A solid dot on 6 with a shaded region extending to the left.
- Divide both sides by 9:
- x + 1 < 9
- Subtract 1 from both sides:
- x < 8
- Graph: An open dot on 8 with a shaded region extending to the left.
- Subtract 1 from both sides:
- x – 7 ≥ 8
- Add 7 to both sides:
- x ≥ 15
- Graph: A solid dot on 15 with a shaded region extending to the right.
- Add 7 to both sides:
- x / 3 ≥ 6
- Multiply both sides by 3:
- x ≥ 18
- Graph: A solid dot on 18 with a shaded region extending to the right.
- Multiply both sides by 3:
- 12 + x ≥ 24
- Subtract 12 from both sides:
- x ≥ 12
- Graph: A solid dot on 12 with a shaded region extending to the right.
- Subtract 12 from both sides:
- 5x < 15
- Divide both sides by 5:
- x < 3
- Graph: An open dot on 3 with a shaded region extending to the left.
- Divide both sides by 5:
- x / 9 > 4
- Multiply both sides by 9:
- x > 36
- Graph: An open dot on 36 with a shaded region extending to the right.
- Multiply both sides by 9:
- x – 2 ≤ 13
- Add 2 to both sides:
- x ≤ 15
- Graph: A solid dot on 15 with a shaded region extending to the left.
- Add 2 to both sides:
Explanation of Graphing:
- The solid dot indicates that the number is included in the solution (i.e., ≤ or ≥).
- The open dot indicates that the number is not included in the solution (i.e., < or >).
- The shaded region shows the range of values that satisfy the inequality. It extends to the left for inequalities with “less than” and to the right for inequalities with “greater than.”