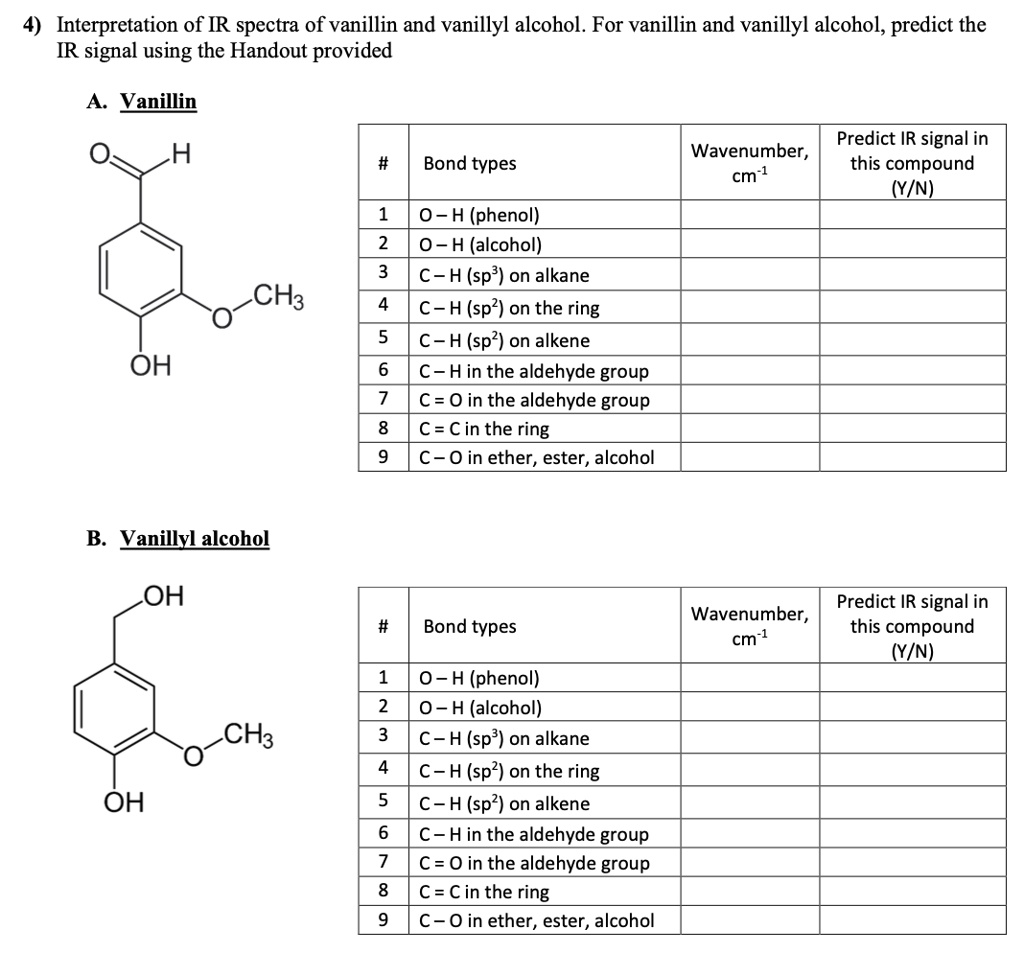
Interpretation of IR spectra of vanillin and vanillyl alcohol. For vanillin and vanillyl alcohol, predict the IR signal using the Handout provided. Vanillin Predict IR signal in Wavenumber, this compound cm (yin) H Bond types O-H (phenol) O-H (alcohol) C-H (sp3) on alkane C-H (sp2) on the ring C-H (sp2) on alkene C-H in the aldehyde group C=O in the aldehyde group C=C in the ring C-O in ether, ester, alcohol CH3 OH Vanillyl alcohol Predict IR signal in Wavenumber, this compound cm (yin) Bond types O-H (phenol) O-H (alcohol) C-H (sp3) on alkane C-H (sp2) on the ring C-H (sp2) on alkene C-H in the aldehyde group C=O in the aldehyde group C=C in the ring C-O in ether, ester, alcohol CH3 OH
The Correct Answer and Explanation is:
Here are the completed tables for vanillin and vanillyl alcohol with the predicted IR signals and a detailed explanation.
A. Vanillin
| # | Bond types | Wavenumber, cm⁻¹ | Predict IR signal in this compound (Y/N) |
| 1 | O–H (phenol) | 3550–3200 (broad) | Y |
| 2 | O–H (alcohol) | N | |
| 3 | C–H (sp³) on alkane | 2950–2850 | Y |
| 4 | C–H (sp²) on the ring | 3100–3000 | Y |
| 5 | C–H (sp²) on alkene | N | |
| 6 | C–H in the aldehyde group | 2850–2700 (two peaks) | Y |
| 7 | C=O in the aldehyde group | 1700–1680 (strong) | Y |
| 8 | C=C in the ring | 1600–1450 | Y |
| 9 | C–O in ether, ester, alcohol | 1300–1000 | Y |
B. Vanillyl alcohol
| # | Bond types | Wavenumber, cm⁻¹ | Predict IR signal in this compound (Y/N) |
| 1 | O–H (phenol) | 3550–3200 (very broad) | Y |
| 2 | O–H (alcohol) | 3650–3200 (very broad) | Y |
| 3 | C–H (sp³) on alkane | 2950–2850 | Y |
| 4 | C–H (sp²) on the ring | 3100–3000 | Y |
| 5 | C–H (sp²) on alkene | N | |
| 6 | C–H in the aldehyde group | N | |
| 7 | C=O in the aldehyde group | N | |
| 8 | C=C in the ring | 1600–1450 | Y |
| 9 | C–O in ether, ester, alcohol | 1300–1000 | Y |
Explanation
The predictions for the IR spectra of vanillin and vanillyl alcohol are based on the functional groups present in each molecule.
Vanillin Analysis:
Vanillin’s structure contains a phenolic hydroxyl (O-H) group, an aldehyde (CHO), an ether (O-CH3), and an aromatic ring. The phenolic O–H bond gives a characteristic broad signal around 3550–3200 cm⁻¹. The methyl ether group has sp³ C–H bonds, which produce stretches just below 3000 cm⁻¹ (2950–2850 cm⁻¹). The aromatic ring shows sp² C–H stretches just above 3000 cm⁻¹ (3100–3000 cm⁻¹) and C=C bond stretches in the 1600–1450 cm⁻¹ region. The most diagnostic features of vanillin are from its aldehyde group: a strong, sharp C=O (carbonyl) stretch, which is conjugated to the aromatic ring and appears at a lower frequency around 1700–1680 cm⁻¹, and two weak but characteristic aldehyde C–H stretches between 2850–2700 cm⁻¹. Finally, the C–O bonds of the ether and phenol groups will show strong absorptions in the fingerprint region (1300–1000 cm⁻¹).
Vanillyl Alcohol Analysis:
In vanillyl alcohol, the aldehyde group has been reduced to a primary alcohol (CH2OH). It still has the phenolic O–H, ether, and aromatic ring, so it will share many signals with vanillin, including the sp³ C–H, sp² C–H, aromatic C=C, and C–O stretches. However, there are critical differences. Vanillyl alcohol has two types of hydroxyl groups (phenolic and alcoholic), which will result in a very broad and intense O–H signal spanning the 3650–3200 cm⁻¹ range. Most importantly, vanillyl alcohol lacks an aldehyde group. Therefore, its IR spectrum will be missing the strong C=O carbonyl peak around 1700 cm⁻¹ and the specific aldehyde C–H stretches. This absence is the clearest indicator of the conversion from vanillin to vanillyl alcohol.
