What is the correct graphical representation of an endothermic reaction? Reactants 1 6 Reactants Products Reaction Pathway Products Reaction Pathway Products 6 Reactants Products Reaction Pathway Reactants Reaction Pathway 0 A 0 B 0 c 0 D 1
The Correct Answer and Explanation is:
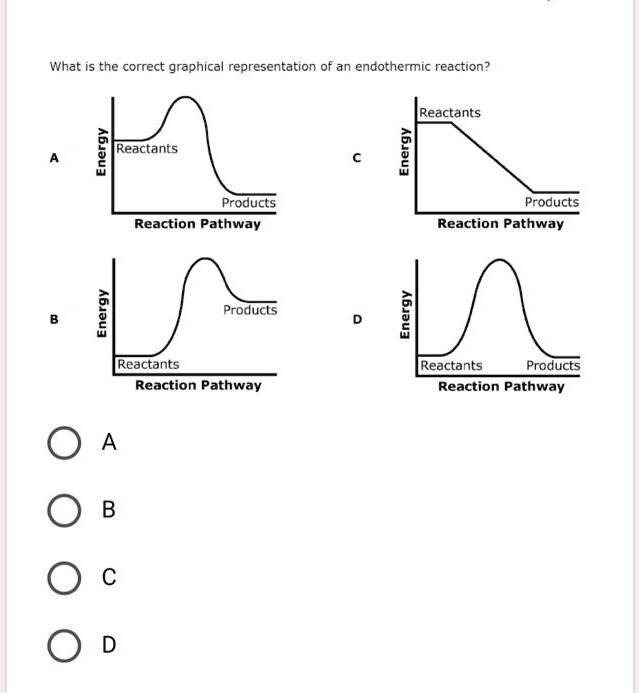
The correct answer is B.
An endothermic reaction is a chemical process that absorbs energy from its surroundings, typically in the form of heat. This fundamental characteristic means that the products of the reaction have a higher potential energy than the reactants. The graphical representation of a reaction’s energy change over its course is called a reaction coordinate diagram or energy profile. In such a diagram, the vertical axis represents energy, and the horizontal axis represents the reaction pathway, or the progress of the reaction.
For an endothermic reaction, the diagram must show that the final energy level of the products is higher than the initial energy level of the reactants. Looking at the provided options, Graph B is the only one that accurately depicts this situation. It starts with the reactants at a lower energy level and finishes with the products at a higher energy level. The difference in height between the product line and the reactant line represents the net energy absorbed during the reaction, which is also known as the change in enthalpy (ΔH). For an endothermic reaction, this value is positive.
Furthermore, a correct reaction profile includes an energy barrier, known as the activation energy. This is the minimum amount of energy required to initiate the reaction. Graphs A, B, and D all correctly show this activation energy as a “hump” that the reactants must overcome to become products.
Let’s review the other options. Graph A shows an exothermic reaction, where the products have less energy than the reactants, indicating a release of energy. Graph D shows the reactants and products at the same energy level, meaning there is no net change in energy (ΔH = 0). Graph C is an incorrect representation because it lacks an activation energy barrier and also depicts an exothermic process. Therefore, Graph B is the only correct graphical representation of an endothermic reaction.