Table 4. One-sided right-tail F-distribution table for α = 0.025 Distribution (α = 0.025 in the Right Tail) Numerator Degrees of Freedom
The Correct Answer and Explanation is:
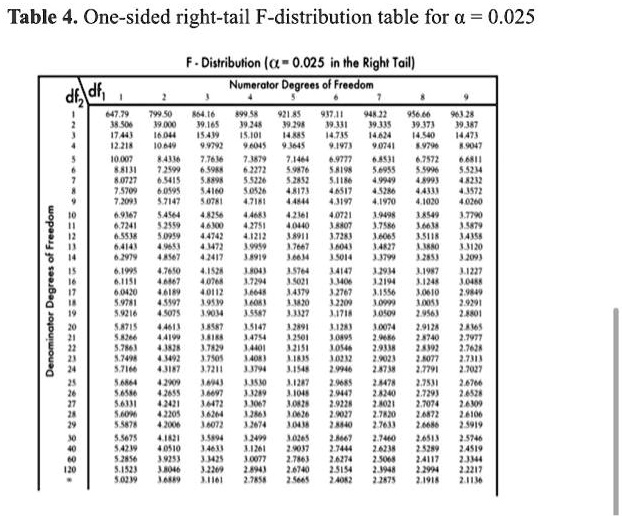
The image provided is a statistical reference table known as a one-sided, right-tail F-distribution table for a significance level (alpha) of 0.025. It provides the critical F-values used in hypothesis testing, particularly in an Analysis of Variance (ANOVA), to determine if an experimental result is statistically significant.
Explanation
This table displays critical values for the F-distribution, a probability distribution that is essential for comparing the variances between two or more samples. The table’s title specifies its precise application. First, the significance level, alpha (α), is 0.025. This means the values in the table represent the point on the F-distribution curve beyond which 2.5% of the area lies. This area is known as the rejection region. If a calculated test statistic falls into this region, the result is considered statistically significant. Second, it is a “one-sided right-tail” table, making it suitable for tests where you are checking if one variance is significantly greater than another.
To use the table, you need two values called degrees of freedom, which are calculated from your sample data. The “Numerator Degrees of Freedom” (df₁) are listed across the top row of the table. The “Denominator Degrees of Freedom” (df₂) are listed down the first column. The body of the table contains the critical F-values.
For example, to find the critical F-value for an experiment with 4 numerator degrees of freedom (df₁ = 4) and 20 denominator degrees of freedom (df₂ = 20), you would perform the following steps. First, locate the column corresponding to df₁ = 4. Next, locate the row corresponding to df₂ = 20. The number at the intersection of that column and row is the critical F-value, which is 3.5147.
In a hypothesis test like ANOVA, you compare your calculated F-statistic to this critical value. If your calculated F-statistic is greater than 3.5147, you would reject the null hypothesis. This provides strong evidence that the observed differences between the groups in your study are unlikely to be due to random chance.