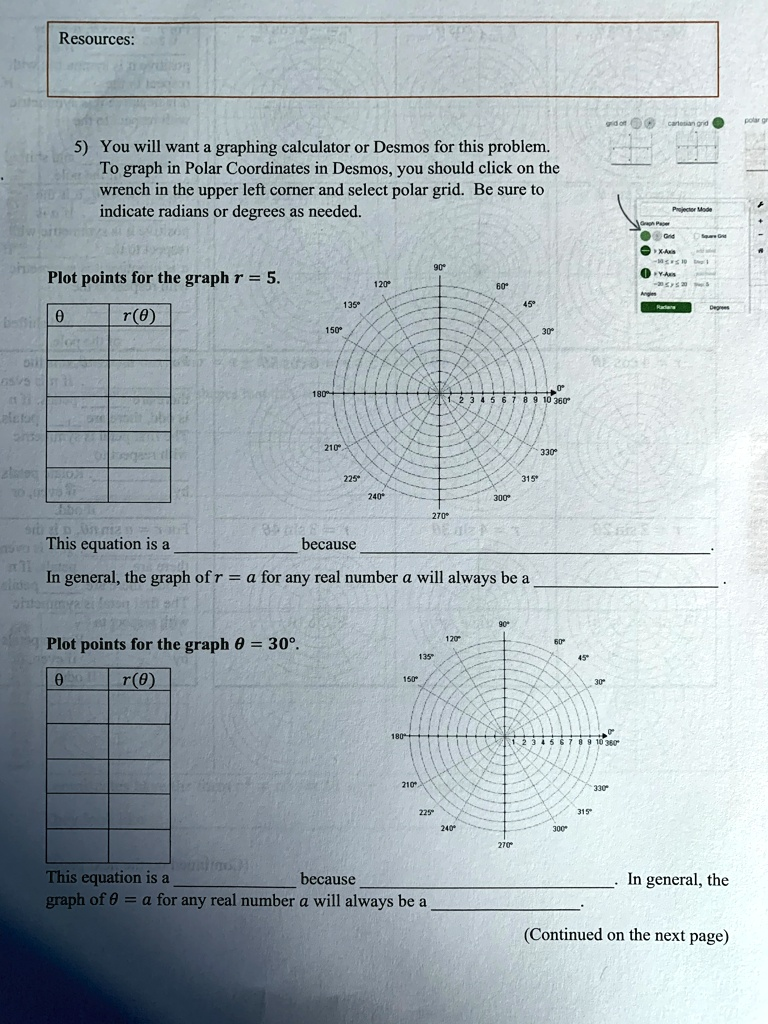
You will want a graphing calculator or Desmos for this problem.
The Correct Answer and Explanation is:
Here are the correct answers for the worksheet, followed by a detailed explanation.
Completed Worksheet Answers
Part 1: Plot points for the graph r = 5
Table:
| θ | r(θ) |
|—|—|
| 0° | 5 |
| 90° | 5 |
| 180° | 5 |
| 270° | 5 |
| 360° | 5 |
This equation is a circle because the radius, or distance from the origin, is a constant value of 5 for every possible angle.
In general, the graph of r = a for any real number a will always be a circle centered at the origin with a radius of |a|.
Part 2: Plot points for the graph θ = 30°
Table (listing some possible points):
| r | θ |
|—|—|
| 2 | 30° |
| 4 | 30° |
| 6 | 30° |
| -2 | 30° |
| -4 | 30° |
This equation is a line because the angle is fixed at 30° for any possible radius, including positive and negative values.
In general, the graph of θ = a for any real number a will always be a line passing through the origin.
Explanation
This worksheet introduces two fundamental types of graphs in the polar coordinate system.
For the first problem, we analyze the equation r equals 5. In polar coordinates, every point is defined by its distance from the origin, called the radius (r), and its angle from the positive x axis, called theta (θ). The equation r equals 5 means that for any angle you choose, the distance from the origin is always 5 units. When completing the table, no matter which angle is selected for theta, such as 0 degrees, 90 degrees, or 180 degrees, the value of r will always be 5. When you plot these points on the polar grid, you will see that they all lie at the same distance from the center. Connecting these points forms a perfect circle with its center at the origin and a radius of 5. This is consistent with the geometric definition of a circle, which is the set of all points equidistant from a central point. Therefore, any equation in the form r equals a constant ‘a’ will always graph as a circle centered at the pole with a radius equal to the absolute value of ‘a’.
For the second problem, we look at the equation theta equals 30 degrees. This equation states that for any point on the graph, its angle must be 30 degrees. The radius, r, is not defined by the equation, meaning it can take on any real value. To plot points, we can choose various values for r. For example, if r is 2, the point is (2, 30 degrees). If r is 5, the point is (5, 30 degrees). If r is a negative value like negative 4, the point (negative 4, 30 degrees) is plotted 4 units in the opposite direction of the 30 degree angle, which is along the 210 degree line. All these points, regardless of the value of r, will fall along a single straight line that passes through the origin and makes a 30 degree angle with the polar axis. Thus, the graph is a line. In general, any equation of the form theta equals a constant angle ‘a’ represents a straight line that passes through the origin at that specific angle.