N 1 2 3 4 5 6 7 8 9 10 11 12 13 14 15 16 17 18 19 20 21 22 23 24 25 26 27 28 29 30
The Correct Answer and Explanation is:
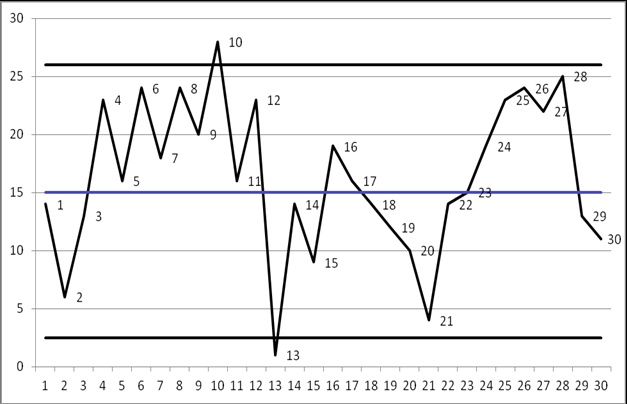
Based on a visual analysis of the control chart, here are the approximate values for each of the 30 data points:
N: 1, 2, 3, 4, 5, 6, 7, 8, 9, 10, 11, 12, 13, 14, 15, 16, 17, 18, 19, 20, 21, 22, 23, 24, 25, 26, 27, 28, 29, 30
Value: 14, 6, 14, 23, 16, 24, 18, 24, 20, 27, 16, 23, 2, 13, 9, 19, 16, 14, 11, 10, 4, 13, 15, 22, 24, 23, 22, 25, 12, 10
The image displays a control chart, a fundamental tool in statistical process control used to monitor a process’s stability and variation over time. This chart plots 30 sequential data points against a central line and two control limits. The blue central line, positioned at a value of 15, represents the historical average or mean of the process. The two black horizontal lines are the upper control limit (UCL) at approximately 26 and the lower control limit (LCL) at approximately 3. These limits define the expected range of random variation. Any data point falling outside these limits signals a potential issue.
This particular process is not in a state of statistical control. This conclusion is drawn from clear evidence of “special cause” variation, which are events that are not part of the normal process. Specifically, point 10, with a value of approximately 27, clearly exceeds the upper control limit. Similarly, point 13, with a value of about 2, falls significantly below the lower control limit. These out of control points indicate that unusual, nonrandom events affected the process at those specific times, warranting investigation to find the root cause.
Furthermore, the chart exhibits nonrandom patterns within the control limits, which also suggest a lack of stability. For instance, there is a long run of nine consecutive points (points 4 through 12) all located above the centerline. Another concerning pattern is the steady downward trend from point 16 to point 21, followed by a sharp upward trend from point 21 to point 25. These predictable patterns are inconsistent with a process that is only subject to random, common cause variation. In summary, the numerous signals on this chart strongly indicate that the process is unstable and unpredictable, requiring corrective action to bring it into a state of statistical control.