Which of the graphs below represents the equation 3x 2y -12? Graph A Graph B Graph € Graph D
The Correct Answer and Explanation is:
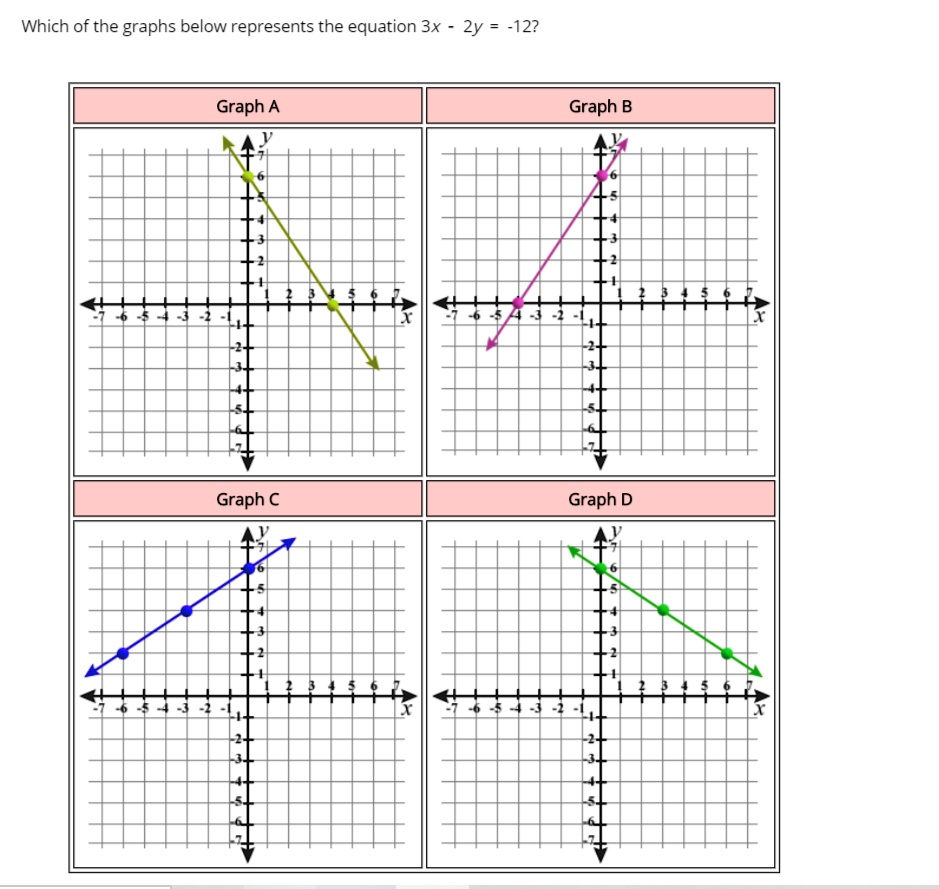
The correct answer is Graph B.
To determine which graph represents the equation 3x – 2y = -12, we can convert the equation into slope-intercept form, which is y = mx + b. In this form, ‘m’ represents the slope of the line, and ‘b’ represents the y-intercept, which is the point where the line crosses the vertical y-axis.
First, let’s rearrange the equation 3x – 2y = -12 to solve for y:
- Subtract 3x from both sides of the equation:
-2y = -3x – 12 - Divide every term by -2 to isolate y:
y = (-3x / -2) – (12 / -2) - Simplify the expression:
y = (3/2)x + 6
From this slope-intercept form, we can identify two key features of the graph. The y-intercept (b) is 6. This means the line must pass through the point (0, 6) on the y-axis. The slope (m) is 3/2. A positive slope indicates that the line will rise as it moves from left to right. Specifically, a slope of 3/2 means that for every 3 units the line goes up (the rise), it will move 2 units to the right (the run).
Now, let’s examine the four graphs:
- Graph A has a y-intercept of 6, but its slope is negative (it goes down from left to right). This is incorrect.
- Graph C and Graph D do not match the required slope of 3/2. Graph D has a negative slope, and Graph C has a positive slope that is less steep than 3/2.
- Graph B has a y-intercept at (0, 6). To check the slope, we can start at the y-intercept (0, 6) and move 3 units up and 2 units to the right, which would lead to the point (2, 9). Alternatively, we can see that the line also passes through the point (-4, 0). Moving from (-4, 0) to (0, 6), the rise is 6 and the run is 4. The slope is rise/run = 6/4, which simplifies to 3/2.
Therefore, Graph B is the only graph with a y-intercept of 6 and a slope of 3/2, correctly representing the equation y = (3/2)x + 6.