The Correct Answer and Explanation is:
Correct Answer:
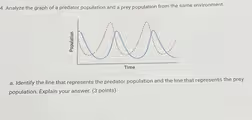
The line that reaches higher population peaks represents the prey, while the line that has lower population peaks represents the predator.
Explanation:
This identification is based on two core principles of predator and prey interactions, both of which are illustrated in the graph’s cyclical pattern.
First, there must be a larger population of prey to support a smaller population of predators. In any ecosystem, the total biomass and number of organisms decrease at higher trophic levels. The prey are the food source, or energy, for the predators. To sustain the predator population, the prey population must be significantly larger. The graph clearly shows one population line consistently reaching a higher number on the population axis than the other. This line with the higher peaks and larger overall population size represents the prey. The line with the lower peaks represents the predator population, which is limited by the availability of its food source.
Second, the populations of predators and prey are linked in a cause and effect cycle that involves a time lag. The fluctuation in the predator’s population follows the fluctuation in the prey’s population. When the prey population increases, it provides an abundant food source for the predators. With more food available, the predator population can grow and reproduce more successfully, causing its numbers to rise. This is why the peak of the predator’s population curve on the graph occurs shortly after the peak of the prey’s population curve.
Conversely, as the predator population increases, they consume more prey, which causes the prey population to decline. This reduction in the food supply then leads to increased competition and starvation among the predators, causing their population to decrease as well. This is why the lowest point, or trough, of the predator’s population cycle follows the trough of the prey’s cycle. This characteristic lag effect, where the predator’s population curve mirrors but follows the prey’s curve, is a definitive feature of this ecological relationship.