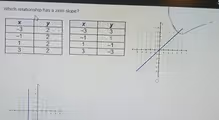
The correct answer is the table on the top left.
A zero slope is a fundamental concept in algebra that describes a specific type of linear relationship. The slope of a line, often represented by the variable ‘m’, measures its steepness and direction. It is calculated as the “rise” divided by the “run,” or the change in the vertical direction (y-axis) for every unit of change in the horizontal direction (x-axis). The formula for slope is m = (y₂ – y₁) / (x₂ – x₁), where (x₁, y₁) and (x₂, y₂) are any two points on the line.
For a relationship to have a zero slope, the numerator of this formula, (y₂ – y₁), must be equal to zero. This happens only when the y-value does not change, meaning y₂ = y₁. In other words, a relationship has a zero slope if the y-coordinate remains constant for all x-coordinates. Graphically, this creates a perfectly horizontal line.
Let’s analyze the given options based on this understanding.
The first table, located at the top left, shows the points (-3, 2), (-1, 2), (1, 2), and (3, 2). In this relationship, the y-value is always 2, regardless of the x-value. Calculating the slope using any two points, for instance (-1, 2) and (3, 2), gives us m = (2 – 2) / (3 – (-1)) = 0 / 4 = 0. Therefore, this relationship has a zero slope.
The other options are incorrect. The second table has changing y-values, resulting in a non-zero slope (specifically, -1). The graph on the top right shows a diagonal line that rises from left to right, indicating a positive slope. The graph on the bottom left shows a vertical line. A vertical line has an undefined slope, not a zero slope, because the x-value is constant, which leads to division by zero in the slope formula.