The Correct Answer and Explanation is:
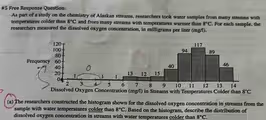
Based on the histogram, here is a description of the distribution of dissolved oxygen concentration in streams with water temperatures colder than 8°C.
Correct Answer:
The distribution of dissolved oxygen concentration is unimodal and skewed to the left. The center of the distribution is in the 11 to 12 mg/L interval, which contains the median and the mode. The data has a range of approximately 12 mg/L, spanning from a low between 2 and 3 mg/L to a high between 13 and 14 mg/L. There is a gap in the data between 3 and 4 mg/L and there are a few potential low outliers below 6 mg/L.
Explanation:
To properly describe the distribution shown in the histogram, we analyze its shape, center, spread, and any unusual features.
The shape of the distribution is unimodal and skewed to the left. It is considered unimodal because it has one distinct peak. This peak, representing the most common outcome, occurs in the bin for dissolved oxygen concentrations between 11 and 12 mg/L. The distribution is skewed to the left, also known as negatively skewed, because the tail of the data extends further towards the lower values. This means that while most streams have high concentrations of dissolved oxygen, a smaller number of streams have progressively lower concentrations.
The center of the distribution can be located by finding the median. The total number of samples is 429, so the median is the 215th value. Based on the frequencies, this median value falls within the 11 to 12 mg/L interval. This interval also contains the mode, which is the interval with the highest frequency of 117 samples. Therefore, a typical dissolved oxygen concentration for a colder stream in this study is between 11 and 12 mg/L.
The spread of the data describes its variability. The dissolved oxygen concentrations range from a minimum value in the 2 to 3 mg/L bin to a maximum value in the 13 to 14 mg/L bin. This results in an overall range of approximately 12 mg/L. However, the vast majority of the data is concentrated between 9 and 14 mg/L.
Finally, there are notable unusual features. The histogram reveals a clear gap, as there were no water samples with dissolved oxygen concentrations between 3 and 4 mg/L. Additionally, there are potential outliers on the low end. The few samples with concentrations below 6 mg/L are separated from the main cluster of data, suggesting they may be unusual observations.