In October of 2004, British regulators were forced to suspend the license of a flu vaccine plant in Liverpool operated by the Chiron Corporation due to concerns over bacterial contamination. As a result, the market was less competitive and the remaining suppliers of the flu vaccine experienced an increase in their market power. Suppose that you are the manager of one of the remaining pharmaceutical companies still making this flu vaccine, and that the market for your company is represented by the following graph:
a. What price per dose should your company charge, and how many doses should it produce? b. Is the profit-maximizing price found in part (a) greater than the marginal cost of producing the good (yes or no)? c. Compare the marginal benefit and marginal cost at your company’s profit maximizing level of output (9 million). Are they equal or is one higher than the other? d. If this was a perfectly competitive market, what price would exist and how many units of the flu vaccine would be produced? e. Would this market be efficient if it was perfectly competitive?
The Correct Answer and Explanation is :
To answer these questions, we will analyze the graph and use economic principles. Here’s a step-by-step explanation:
a. Profit-Maximizing Price and Quantity
In a monopoly or market with limited suppliers, the profit-maximizing price and quantity are found where marginal revenue (MR) equals marginal cost (MC).
From the graph:
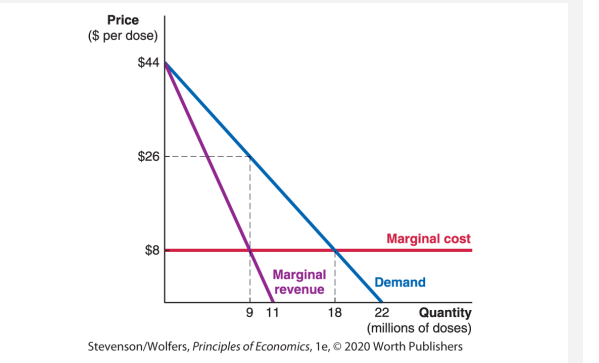
- Quantity (Q): 9 million doses.
- Price (P): $30 per dose.
b. Is the Profit-Maximizing Price Greater than Marginal Cost?
Yes.
From the graph, at 9 million doses:
- Marginal Cost (MC): $10 per dose.
- Price (P): $30 per dose.
The price significantly exceeds the marginal cost, which is typical in monopolistic markets due to restricted output and market power.
c. Comparison of Marginal Benefit and Marginal Cost
At 9 million doses:
- Marginal Benefit (MB): Represented by the price consumers are willing to pay, which is $30.
- Marginal Cost (MC): $10.
Since MB > MC, the output level is below the socially optimal level, creating a deadweight loss.
d. Perfectly Competitive Price and Quantity
In a perfectly competitive market, price equals marginal cost (P = MC).
From the graph:
- Price (P): $10 per dose.
- Quantity (Q): 15 million doses.
e. Would the Market Be Efficient in Perfect Competition?
Yes.
Efficiency in economics occurs when MB = MC. In a perfectly competitive market:
- Price (P): Reflects marginal benefit (MB).
- Quantity (Q): Maximizes total surplus by equating MB and MC.
Thus, a competitive market would eliminate deadweight loss and produce at the socially optimal quantity (15 million doses).
Explanation (300 words)
The suspension of Chiron Corporation’s flu vaccine plant in 2004 reduced market competition, giving remaining suppliers greater pricing power. For a firm with market power, the profit-maximizing quantity is determined where marginal revenue equals marginal cost (MR = MC). At this point, the firm chooses a price from the demand curve. From the graph, the optimal quantity is 9 million doses at a price of $30 per dose. This price exceeds the marginal cost of $10, which is a hallmark of monopolistic pricing.
At the profit-maximizing output, marginal benefit (the price consumers are willing to pay) exceeds marginal cost (MC). This gap indicates underproduction compared to the socially optimal level, causing a deadweight loss. If the market were perfectly competitive, price would equal marginal cost ($10), and 15 million doses would be produced. This output level eliminates deadweight loss and maximizes societal welfare, as marginal benefit equals marginal cost (MB = MC).
Perfect competition ensures efficiency by aligning price with production costs and consumer valuation. However, the monopolistic setting in this scenario results in higher prices and lower output, benefiting producers at the expense of consumers and societal welfare. Thus, while the market is profitable for the remaining suppliers, it operates inefficiently compared to the competitive ideal.