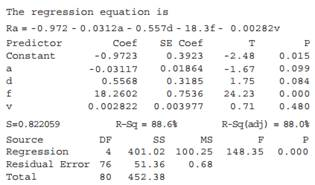
The accompanying Minitab regression output is based on data that appeared in the article “Application of Design of Experiments for Modeling Surface Roughness in Ultrasonic Vibration Turning” (J. of Engr. Manuf., 2009: 641–652). The response variable is surface roughness (mm), and the independent variables are vibration amplitude (mm), depth of cut (mm), feed rate (mm/rev), and cutting speed (m/min), respectively
a. Predict the value of surface roughness when amplitude is 10, depth of cut is .5, feed rate is .25, and cutting speed is 50.
b. What proportion of observed variation in surface roughness can be explained by the approximate relationship between surface roughness and the four predictors?
The Correct Answer and Explanation is :
Given the regression equation for predicting surface roughness (Ra) in ultrasonic vibration turning:
Ra = -0.972 – 0.0312a + 0.557d + 18.3f + 0.00282v
where:
- a = vibration amplitude (mm)
- d = depth of cut (mm)
- f = feed rate (mm/rev)
- v = cutting speed (m/min)
a. Predicting Surface Roughness
To predict the surface roughness when the input parameters are:
- Amplitude (a) = 10 mm
- Depth of cut (d) = 0.5 mm
- Feed rate (f) = 0.25 mm/rev
- Cutting speed (v) = 50 m/min
Substitute these values into the regression equation:
Ra = -0.972 – 0.0312(10) + 0.557(0.5) + 18.3(0.25) + 0.00282(50)
Calculating each term:
- Constant: -0.972
- Amplitude: -0.0312 × 10 = -0.312
- Depth of cut: 0.557 × 0.5 = 0.2785
- Feed rate: 18.3 × 0.25 = 4.575
- Cutting speed: 0.00282 × 50 = 0.141
Summing these contributions:
Ra = -0.972 – 0.312 + 0.2785 + 4.575 + 0.141
Ra ≈ 3.7105 mm
Therefore, the predicted surface roughness is approximately 3.7105 mm.
b. Proportion of Variation Explained
The coefficient of determination, denoted as R², indicates the proportion of the variance in the dependent variable (surface roughness) that is predictable from the independent variables.
From the regression output:
- R² = 88.6%
This means that 88.6% of the observed variation in surface roughness can be explained by the linear relationship with the four predictors: vibration amplitude, depth of cut, feed rate, and cutting speed.
Explanation
In multiple linear regression, R² measures the goodness of fit of the model. An R² value of 88.6% suggests that the model explains a substantial portion of the variability in surface roughness, indicating a strong relationship between the predictors and the response variable.
However, it’s important to consider the adjusted R², especially when multiple predictors are involved. The adjusted R² accounts for the number of predictors relative to the number of data points and provides a more accurate measure of model performance.
In this case, the adjusted R² is 88.0%, which is slightly lower than the R² but still indicates a strong model fit.
While a high R² value indicates that the model explains a large portion of the variance, it doesn’t guarantee that the model is appropriate or that the predictors are significant.
Statistical tests, such as the F-test for overall model significance and t-tests for individual predictors, should be conducted to assess the validity and significance of the model and its predictors.
Additionally, examining residual plots can help verify the assumptions of linearity, homoscedasticity, and normality, ensuring the reliability of the regression analysis.