Excel Project: Using Benford’s Law to Detect Potential Disbursements Fraud.*
REQUIRED
a. Read the article “Using Spreadsheets and Benford’s Law to Test Accounting Data,” by Mark G. Simkin in the ISACA Journal, 2010, Vol. 1, available at www .isaca.org.
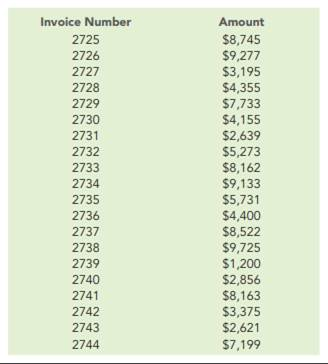
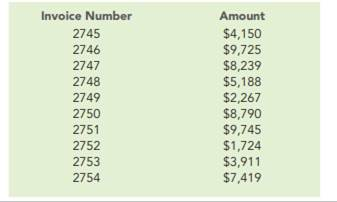
b. Download the spreadsheet for this problem and follow the steps in the article to analyze whether the invoice data conforms to Benford’s Law. Your spreadsheet should:
1. Display the first digit for each invoice amount (Hint: You may need to use the Value and Left functions).
2. Complete the columns for “Expected # ” and “Actual # ” for the data set.
3. Use a formula in cell F13 that calculates the sample size.
4. Use a formula in cell G15 to calculate the chi-square test value comparing the actual and expected distribution of leading digits of invoice amounts.
5. Create a chart that compares the actual and expected frequencies for the leading digits for invoice amounts.
The Correct Answer and Explanation is :
To analyze potential disbursements fraud using Benford’s Law in Excel, follow these steps:
Steps to Implement Benford’s Law Analysis
1. Extract First Digits
- Use the formula
=VALUE(LEFT(A2,1))in a new column to extract the first digit of each invoice amount from columnA(assuming invoice amounts are in column A, starting at row 2). - Drag this formula down to analyze all rows in the dataset.
2. Calculate Expected and Actual Frequencies
- Expected Frequencies:
Use Benford’s Law probabilities for the leading digits (1 through 9):
[
P(d) = \log_{10}(1 + \frac{1}{d})
]
where (d) is the digit. Enter these probabilities in a column (e.g., B2:B10). Digit Expected % Formula 1 30.10%=LOG10(1 + 1/1)2 17.61%=LOG10(1 + 1/2)… … … - Actual Frequencies:
UseCOUNTIFto calculate occurrences for each digit:excel =COUNTIF(C:C,1) (For digit "1")
Repeat for all digits (1-9), referencing the column where first digits are extracted.
3. Sample Size
- Calculate the total sample size in cell
F13using:excel =COUNTA(C:C)
4. Chi-Square Test Value
- Compute the Chi-Square statistic in cell
G15:=SUM(((E2:E10 - D2:D10)^2) / D2:D10)E2:E10: Actual counts.D2:D10: Expected counts.
5. Create Comparison Chart
- Insert a Clustered Column Chart:
- X-axis: Digits (1-9).
- Y-axis: Frequencies (Actual vs. Expected).
Key Observations and Interpretation
- Expected Distribution: Benford’s Law predicts a non-linear distribution, with the first digit “1” being the most common (30.10%).
- Deviation Analysis: Significant deviations between actual and expected values indicate irregularities, suggesting possible fraud.
- Chi-Square Test: If the computed value exceeds the critical chi-square threshold for (df=8) (degrees of freedom), the data may not conform to Benford’s Law, warranting further investigation.
This analysis uses statistical principles to identify anomalies, a powerful tool for auditors and fraud investigators. Ensure your chart visually highlights discrepancies for clarity. Would you like assistance creating the formulas in an Excel file?