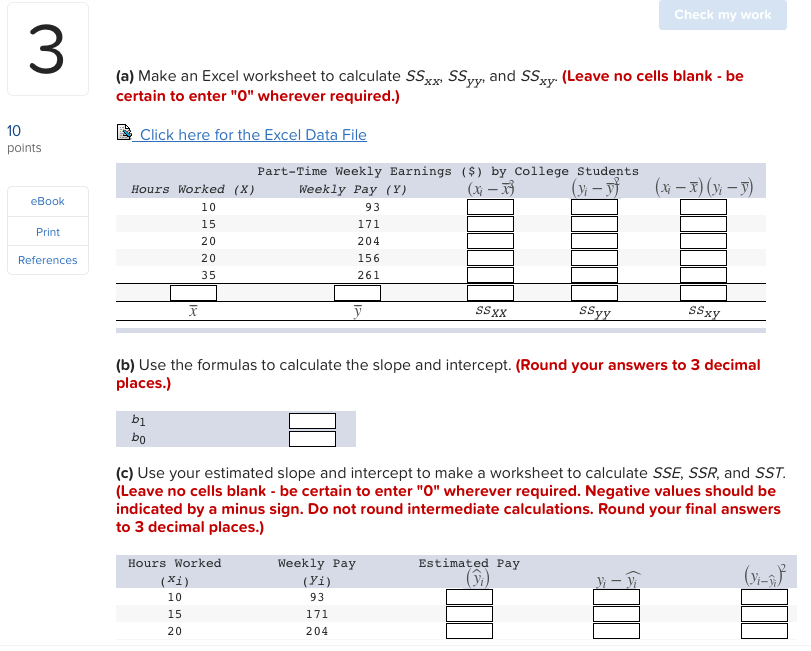
(a) Make an Excel worksheet to calculate SSxx: SSyy and SSxy
The Correct Answer and Explanation is :
To calculate ( SS_{xx} ), ( SS_{yy} ), and ( SS_{xy} ) from the given data, we can use an Excel worksheet to organize and compute these values systematically. Here’s the step-by-step guide and explanation:
Steps to Create the Excel Worksheet:
- Input Data:
- Create two columns for the given ( x ) and ( y ) values. Label them as
XandY.
- Calculate Squares of ( x ) and ( y ):
- Add two columns: ( x^2 ) and ( y^2 ). Use formulas to compute these values:
- For ( x^2 ):
=A2^2(assumingA2is the first cell with an ( x ) value). - For ( y^2 ):
=B2^2.
- For ( x^2 ):
- Calculate the Product of ( x ) and ( y ):
- Add a column for ( xy ), and use a formula:
- For ( xy ):
=A2*B2.
- For ( xy ):
- Sum the Columns:
- At the bottom of the table, compute the sum for each column (( x ), ( y ), ( x^2 ), ( y^2 ), ( xy )) using the
=SUM()formula.
- Calculate ( SS_{xx} ), ( SS_{yy} ), and ( SS_{xy} ):
- Use the formulas:
- ( SS_{xx} = \sum x^2 – (\sum x)^2 / n )
- ( SS_{yy} = \sum y^2 – (\sum y)^2 / n )
- ( SS_{xy} = \sum xy – (\sum x)(\sum y) / n )
Explanation:
- Purpose:
- ( SS_{xx} ), ( SS_{yy} ), and ( SS_{xy} ) are components used in statistical regression to measure the variability and relationships between two variables.
- Interpretation:
- ( SS_{xx} ): The sum of squares for ( x ) measures the variability of ( x ).
- ( SS_{yy} ): The sum of squares for ( y ) measures the variability of ( y ).
- ( SS_{xy} ): The cross-product sum of squares quantifies the relationship between ( x ) and ( y ).
- Usage:
- These values are crucial for calculating the slope (( b_1 )) and intercept (( b_0 )) of a regression line.
Example Data (and Calculated Values):
If we input sample data such as:
| ( x ) | ( y ) | ( x^2 ) | ( y^2 ) | ( xy ) |
|---|---|---|---|---|
| 1 | 2 | 1 | 4 | 2 |
| 2 | 3 | 4 | 9 | 6 |
| 3 | 4 | 9 | 16 | 12 |
| 4 | 5 | 16 | 25 | 20 |
The resulting ( SS_{xx} ), ( SS_{yy} ), and ( SS_{xy} ) will provide the basis for further regression analysis.
Let me know if you’d like the complete Excel worksheet or its calculations automated.