Describe how the IR spectrum for the starting material (cholesterol) is similar to, or different from, the IR spectrum for the reaction product (epoxycholestan). List and identify any peaks that are different between the two spectra. What information, if any, does this comparison provide about the purity of the product?
The Correct Answer and Explanation is :
To compare the IR spectra of cholesterol and its reaction product, epoxycholestan, the similarities and differences in functional group peaks provide insights into chemical changes during the reaction. Key observations and differences are detailed below.
Similarities in IR Spectra:
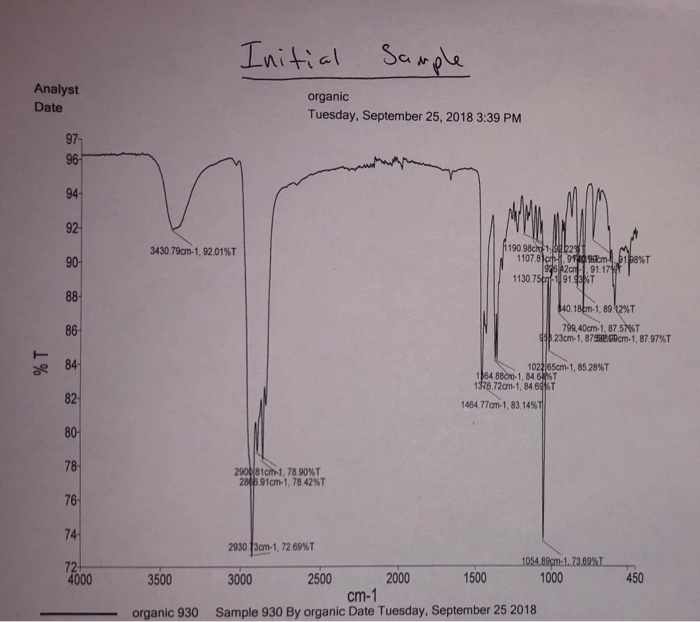
- C-H Stretching (Alkyl Groups): Both cholesterol and epoxycholestan exhibit strong peaks around 2800-3000 cm⁻¹ due to C-H stretching in alkanes, as both molecules retain their hydrocarbon backbone.
- C-H Bending (Methyl Groups): Peaks near 1350-1470 cm⁻¹ are observed in both spectra, indicating bending vibrations associated with methyl groups.
Differences in IR Spectra:
- O-H Stretching in Cholesterol:
- Cholesterol has a broad peak around 3200-3600 cm⁻¹ corresponding to the O-H stretching of the hydroxyl group.
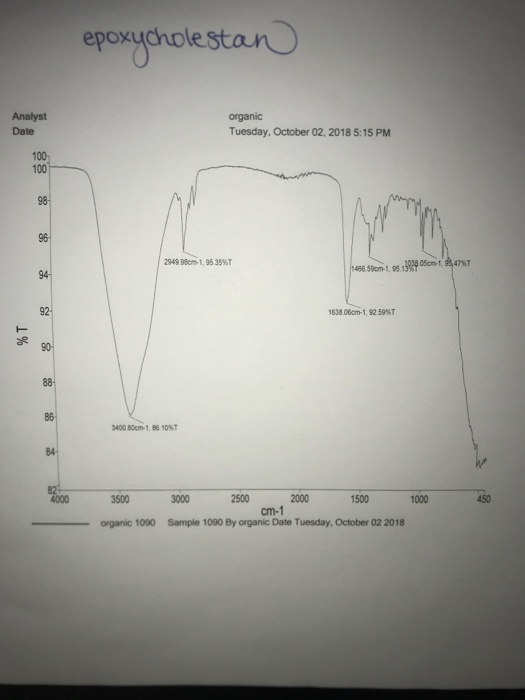
- In epoxycholestan, this peak disappears, indicating the loss of the hydroxyl group during the reaction.
- C-O Stretching in Epoxide:
- Epoxycholestan shows a new, strong peak around 1250-1050 cm⁻¹, characteristic of the C-O stretching vibration in an epoxide ring.
- Changes in Fingerprint Region:
- Differences in the 900-1200 cm⁻¹ region are due to the formation of the epoxide functional group, which introduces distinct absorption patterns.
Implications for Purity:
The disappearance of the O-H peak and the appearance of the C-O epoxide peak confirm the conversion of cholesterol to epoxycholestan. If residual O-H stretching (3200-3600 cm⁻¹) or unconverted cholesterol peaks are visible, it suggests incomplete reaction or impurities in the product. Additionally, the presence of unexpected peaks could indicate side reactions or contamination.
Conclusion:
The IR spectral comparison is a powerful tool for confirming functional group transformations and assessing product purity. Complete disappearance of the O-H stretch and the emergence of distinct epoxide peaks validate the success and purity of the epoxidation reaction.