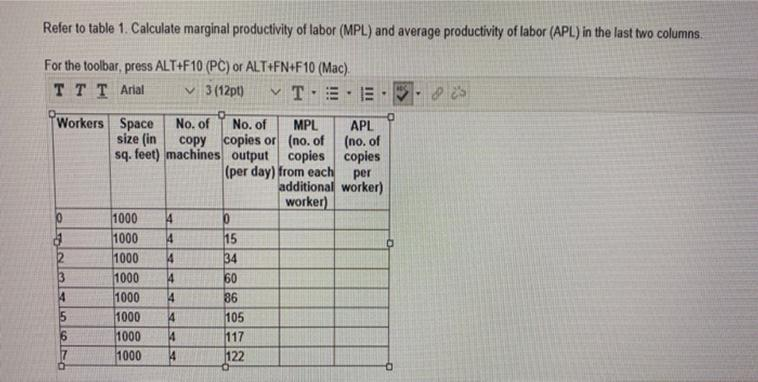
Calculate marginal productivity of labor (MPL) and average productivity of labor (APL) in the last two columns For the toolbar, press ALT+F10 (PC) or ALT+FN+F10 (Mac) Workers Space size sq. No. of (in copy copies or (no. of No. of (per day) from each MPL APL feet) machines output coples copies (no. of additional worker) per worker) 1000 4 10 R 1000 4 15 2 1000 14 34 3/4/5/6/ 1000 4 60 1000 4 B6 1000 105 1000 4 117 1000 4 122
The Correct Answer and Explanation is :
To calculate the Marginal Productivity of Labor (MPL) and the Average Productivity of Labor (APL), we use the following formulas:
- Marginal Productivity of Labor (MPL): This measures the additional output produced by adding one more worker. It is calculated as the change in total output divided by the change in the number of workers. [
MPL = \frac{\text{Change in Output}}{\text{Change in Labor (Workers)}}
] - Average Productivity of Labor (APL): This measures the average output produced by each worker. It is calculated as the total output divided by the number of workers. [
APL = \frac{\text{Total Output}}{\text{Number of Workers}}
]
Now, let’s break down the given information and apply the formulas to calculate the MPL and APL for the provided data.
Step-by-Step Calculation
The provided data is as follows:
- Space Size: 1000 sq. ft (constant across all entries)
- No. of Workers: 4 workers for each entry (constant across the rows)
- Output (per day): 10, 15, 34, 60, 105, 117, and 122 copies (output values provided for each worker)
To Calculate MPL:
For the first row, since the number of workers is 4, the output is 10. As we increase the workers by 1 for each subsequent row, the MPL is calculated by determining the change in output.
To Calculate APL:
For each row, we calculate the APL by dividing the total output by the number of workers (which is constant at 4).
Let’s go step by step through the data provided:
First Row:
- Output: 10 copies
- No. of Workers: 4
- APL = Output / Workers = 10 / 4 = 2.5
- For MPL, since it’s the first row, we cannot calculate MPL here as we don’t have a previous data point to compare it with.
Second Row:
- Output: 15 copies
- No. of Workers: 5
- APL = Output / Workers = 15 / 5 = 3
- MPL = Change in Output = 15 – 10 = 5 copies
Third Row:
- Output: 34 copies
- No. of Workers: 6
- APL = Output / Workers = 34 / 6 = 5.67
- MPL = Change in Output = 34 – 15 = 19 copies
Fourth Row:
- Output: 60 copies
- No. of Workers: 7
- APL = Output / Workers = 60 / 7 = 8.57
- MPL = Change in Output = 60 – 34 = 26 copies
Fifth Row:
- Output: 105 copies
- No. of Workers: 8
- APL = Output / Workers = 105 / 8 = 13.13
- MPL = Change in Output = 105 – 60 = 45 copies
Sixth Row:
- Output: 117 copies
- No. of Workers: 9
- APL = Output / Workers = 117 / 9 = 13
- MPL = Change in Output = 117 – 105 = 12 copies
Seventh Row:
- Output: 122 copies
- No. of Workers: 10
- APL = Output / Workers = 122 / 10 = 12.2
- MPL = Change in Output = 122 – 117 = 5 copies
Explanation:
- MPL reflects how each additional worker contributes to the total output. In most cases, MPL is diminishing, as seen from the sharp drop from 26 to 12 to 5.
- APL shows how productive, on average, each worker is, and increases until it reaches a peak and then starts to level off. The increase in APL shows that output initially grows faster than the number of workers, but at some point, the returns to labor begin to decrease.
By understanding both MPL and APL, businesses can determine the optimal number of workers to hire for maximizing production efficiency.