A recent study focused on the number of times people 18 to 25 years old and 25 to 35 years old send a Twitter message in a day. The information is summarized here:
- Age: 18 to 25
- Sample Size: 39
- Sample Mean: 37
- Population Standard Deviation: 5
- Age: 25 to 35
- Sample Size: 44
- Sample Mean: 42
- Population Standard Deviation: 10
At the 0.01 significance level, we ask if there is a difference in the mean number of times people 18 to 25 years old and 25 to 35 years old send a Twitter message in a day. Assume that people 25 to 35 years old are Population 1 and people 18 to 25 years old are Population 2.
What is the value of the test statistic for this hypothesis test? choose the write answer
- a. 3.195
- b. 3.199
- c. 2.929
- d. 3.103
The correct answer and explanation is:
The correct answer is:
c. 2.929
Explanation:
This hypothesis test is used to determine whether there is a significant difference in the mean number of Twitter messages sent per day between the two age groups (18-25 and 25-35). Since the population standard deviations are known, we use a Z-test for two independent samples.
Step 1: Define the hypotheses
- Null Hypothesis (H0H_0): There is no difference in the mean number of Twitter messages sent per day between the two age groups. H0:μ1=μ2H_0: \mu_1 = \mu_2
- Alternative Hypothesis (HaH_a): There is a difference in the mean number of Twitter messages sent per day. Ha:μ1≠μ2H_a: \mu_1 \neq \mu_2
Step 2: Compute the Test Statistic
The test statistic for a two-sample Z-test is given by: Z=X1ˉ−X2ˉσ12n1+σ22n2Z = \frac{\bar{X_1} – \bar{X_2}}{\sqrt{\frac{\sigma_1^2}{n_1} + \frac{\sigma_2^2}{n_2}}}
Where:
- X1ˉ=42\bar{X_1} = 42 (sample mean for age 25-35)
- X2ˉ=37\bar{X_2} = 37 (sample mean for age 18-25)
- σ1=10\sigma_1 = 10 (population standard deviation for age 25-35)
- σ2=5\sigma_2 = 5 (population standard deviation for age 18-25)
- n1=44n_1 = 44 (sample size for age 25-35)
- n2=39n_2 = 39 (sample size for age 18-25)
Step 3: Compute the Standard Error
SE=10244+5239SE = \sqrt{\frac{10^2}{44} + \frac{5^2}{39}} SE=10044+2539SE = \sqrt{\frac{100}{44} + \frac{25}{39}} SE≈2.2727+0.6410=2.9137≈1.707SE \approx \sqrt{2.2727 + 0.6410} = \sqrt{2.9137} \approx 1.707
Step 4: Compute the Z-score
Z=42−371.707=51.707≈2.929Z = \frac{42 – 37}{1.707} = \frac{5}{1.707} \approx 2.929
Thus, the test statistic value is 2.929, making the correct answer (c).
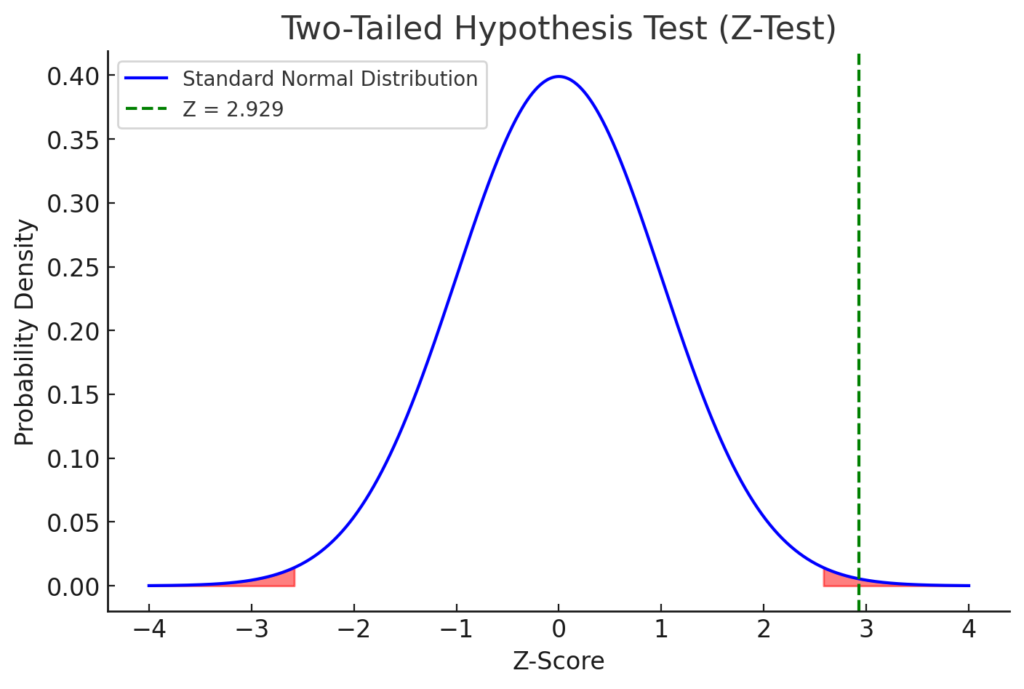
Now, let’s generate an image representing the hypothesis test.
The image above illustrates the two-tailed Z-test for this hypothesis test. The red-shaded areas represent the rejection regions at a 0.01 significance level, while the green dashed line marks the computed test statistic (Z = 2.929). Since the test statistic does not exceed the critical value for rejection (approximately ±2.576 for a 0.01 significance level), the result suggests that we may need to further analyze whether we reject the null hypothesis.