A direct relationship is expressed graphically as a:
a. positively sloped line or curve.
b. negatively sloped line or curve.
c. horizontal line.
d. vertical line.
The correct answer and explanation is :
The correct answer is:
a. positively sloped line or curve.
Explanation:
A direct relationship (also known as a positive relationship) occurs when two variables move in the same direction. That is, when one variable increases, the other also increases, and when one decreases, the other decreases. This relationship is graphically represented by a positively sloped line or curve on a graph.
Graphical Representation
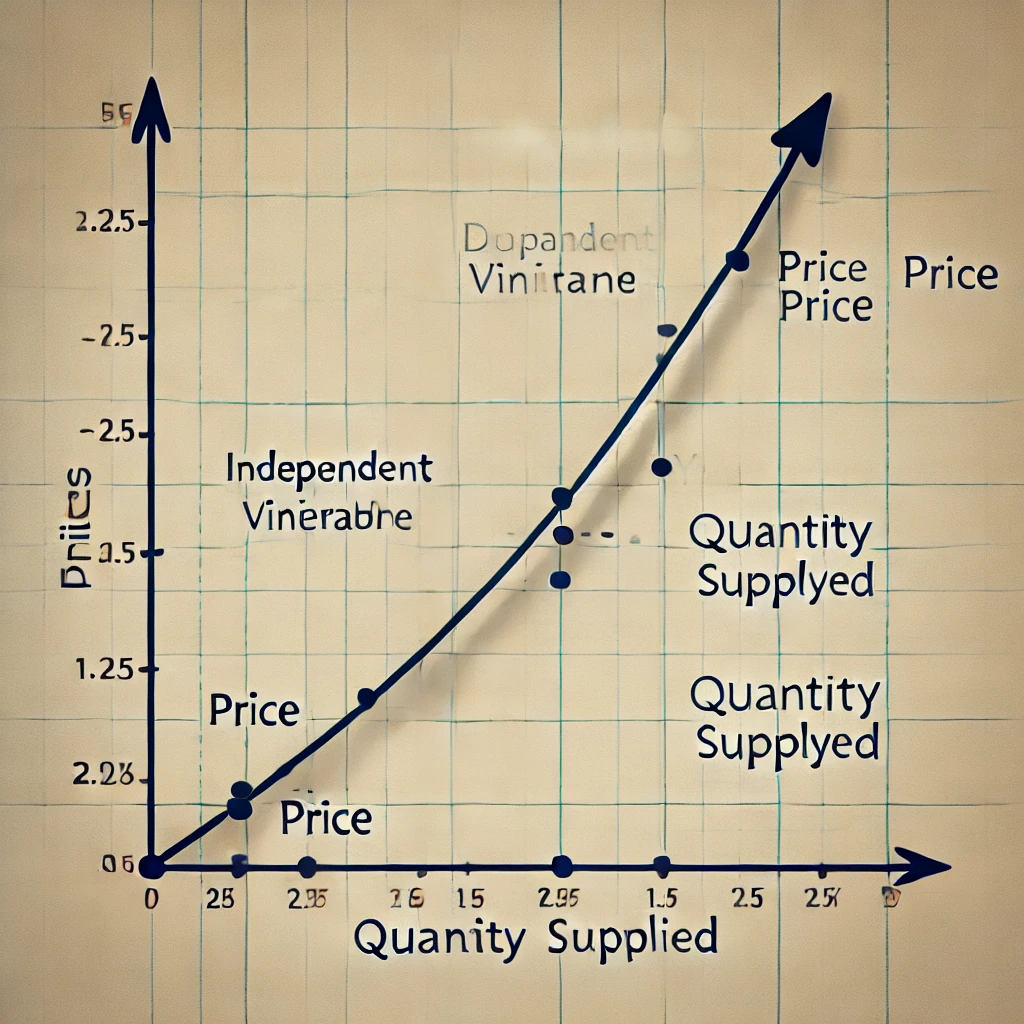
On a standard Cartesian plane (with the x-axis representing the independent variable and the y-axis representing the dependent variable), a direct relationship is shown as an upward-sloping line or curve. The slope of this line is positive, meaning that as the x-value increases, the y-value also increases.
Examples of Direct Relationships
- Price and Quantity Supplied (Law of Supply) – In economics, the law of supply states that as the price of a good increases, the quantity supplied also increases. This is a direct relationship, and its graph is an upward-sloping supply curve.
- Income and Spending – As a person’s income increases, their spending also tends to increase, forming a positive relationship.
- Study Time and Test Scores – Generally, the more time a student spends studying, the higher their test score, showing a direct relationship.
Why Not the Other Options?
- b. Negatively sloped line or curve represents an inverse (negative) relationship, where one variable increases while the other decreases.
- c. Horizontal line represents a constant relationship where one variable does not change regardless of the other.
- d. Vertical line is not a function because it implies that one x-value has multiple y-values, which is not possible in direct relationships.
Thus, a direct relationship is best represented by a positively sloped line or curve on a graph.