How does the empirical rule help explain the ways in which the values in a set of numerical data cluster and distribute?
The correct answer and explanation is :
Correct Answer:
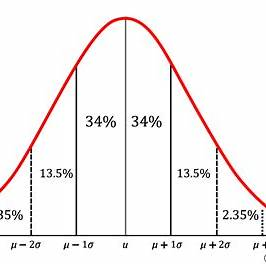
The Empirical Rule (also known as the 68-95-99.7 Rule) states that for a normal distribution, approximately:
- 68% of the data falls within one standard deviation (σ) of the mean (μ).
- 95% of the data falls within two standard deviations of the mean.
- 99.7% of the data falls within three standard deviations of the mean.
Explanation:
The Empirical Rule helps describe how data is distributed in a bell-shaped (normal) curve. It provides insight into how data clusters around the mean and how much variation exists.
- Understanding Data Clustering
The rule shows that most of the data values in a normal distribution are centered around the mean. For example, if the average test score in a class is 75 with a standard deviation of 5, then:
- 68% of students score between 70 and 80.
- 95% score between 65 and 85.
- 99.7% score between 60 and 90.
This helps us see that extreme values (outliers) are rare.
- Identifying Unusual Data Points
The rule helps determine if a data point is unusual. If a value is more than two or three standard deviations away from the mean, it is uncommon and could be an outlier. - Real-World Applications
- Quality Control: Ensures most products meet quality standards.
- Medical Studies: Analyzes patient data (e.g., normal cholesterol levels).
- Stock Market: Evaluates price fluctuations.
By understanding the Empirical Rule, we can predict how data behaves, identify outliers, and make informed decisions.