Mr Zuro finds the mean height of all 14 students
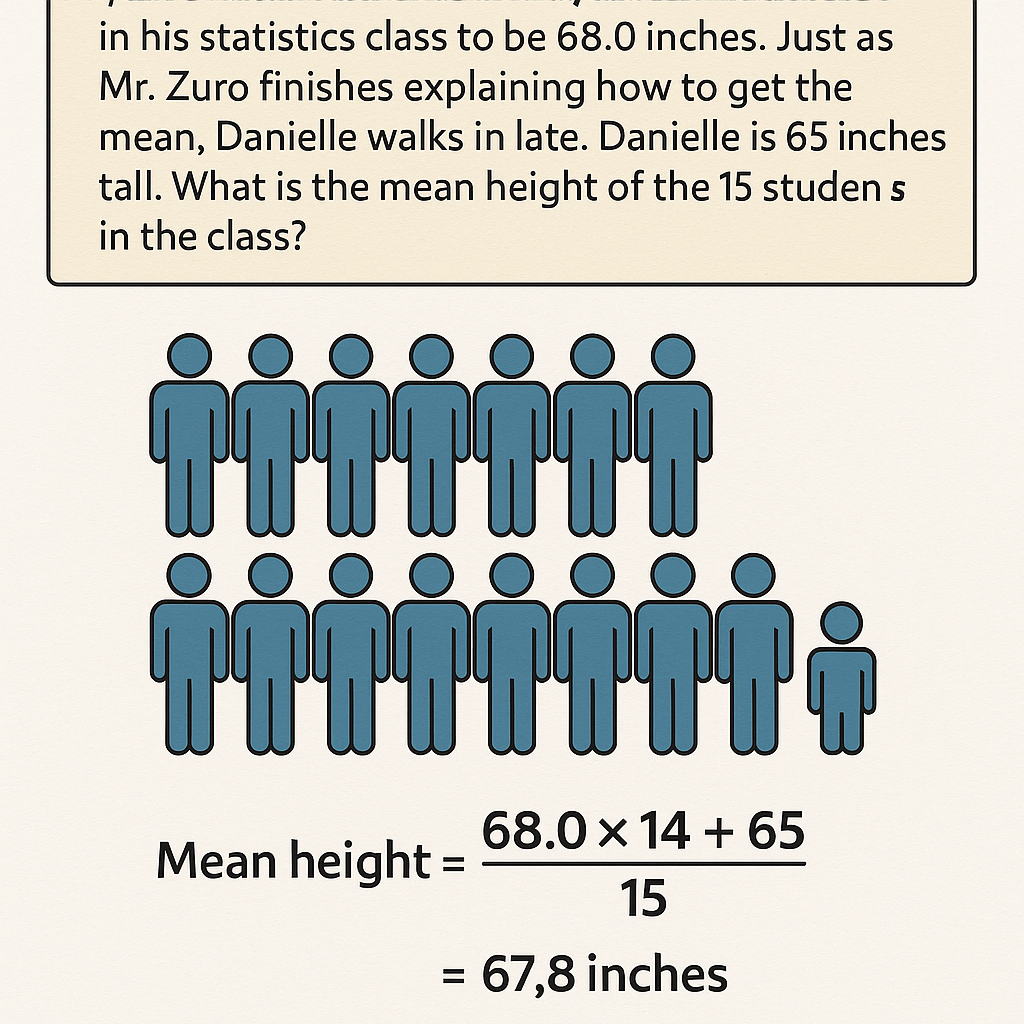
Mr. Zuro finds the mean height of all 14 students in his statistics class to be 68.0 inches. Just as Mr. Zuro finishes explaining how to get the mean, Danielle walks in late. Danielle is 65 inches tall. What is the mean height of the 15 students in the class?
The correct answer and explanation is :
To find the new mean height after Danielle joins the class, we need to calculate the total height of all 15 students and then divide that total by 15.
Step 1: Find the total height of the first 14 students
Mr. Zuro said the mean height of the original 14 students is 68.0 inches.
We use the formula for mean:
[
\text{Mean} = \frac{\text{Total Sum}}{\text{Number of Values}}
]
So,
[
\text{Total height of 14 students} = 68.0 \times 14 = 952 \text{ inches}
]
Step 2: Add Danielle’s height
Danielle is 65 inches tall. Add her height to the existing total:
[
952 + 65 = 1017 \text{ inches}
]
Step 3: Divide the new total by 15 students
[
\text{New Mean} = \frac{1017}{15} = 67.8 \text{ inches}
]
✅ Final Answer: The new mean height is 67.8 inches.
📝 Explanation (300 words)
Understanding how the mean changes with the addition of a new value is essential in statistics. Mr. Zuro initially calculated the mean height of 14 students in his class as 68.0 inches. This means that if we added up all 14 students’ heights and divided that total by 14, the result would be 68.0. To find the total height of these 14 students, we multiply the mean by the number of students:
[
68.0 \times 14 = 952 \text{ inches}
]
This gives us the total combined height of the 14 students. When Danielle walks in, we learn that her height is 65 inches. To determine the new average height with her included, we must add her height to the original total, resulting in:
[
952 + 65 = 1017 \text{ inches}
]
Now, the class has 15 students. To find the new mean, we divide the new total by 15:
[
\frac{1017}{15} = 67.8 \text{ inches}
]
This slight decrease from 68.0 to 67.8 inches makes sense because Danielle’s height (65 inches) is below the original average. This “pulls down” the average slightly. In statistics, this is an example of how adding a data point below the mean lowers the overall average. Understanding how new data affects a mean is helpful for analyzing trends in larger datasets too.