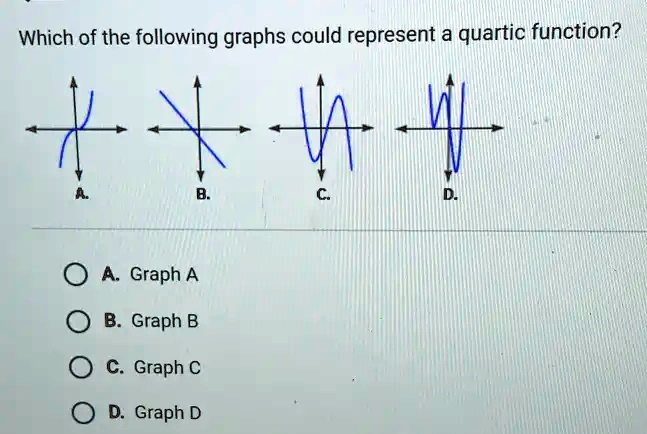
Which of the following graphs could represent a quartic function? A. B. C. D. A. Graph A B. Graph B C. Graph C D. Graph D
The Correct Answer and Explanation is:
The correct answer is: C. Graph C
Explanation (300 words):
A quartic function is a polynomial function of degree 4. It has the general form: f(x)=ax4+bx3+cx2+dx+ef(x) = ax^4 + bx^3 + cx^2 + dx + e
Key characteristics of quartic functions include:
- Degree 4 Behavior: Since the degree is even, the ends of the graph (as x→±∞x \to \pm \infty) either both rise (if the leading coefficient a>0a > 0) or both fall (if a<0a < 0). This is known as having the same end behavior on both sides.
- Turning Points: A quartic function can have up to 3 turning points (local minima or maxima) and up to 4 real roots (x-intercepts), depending on its coefficients.
Now, let’s analyze each graph:
- Graph A: This graph has two turning points and opposite end behavior. One end goes up and the other goes down. This indicates an odd-degree polynomial, likely cubic, not quartic.
- Graph B: This is a straight line with no curves, which means it’s a linear function (degree 1), not quartic.
- Graph C: This graph has three turning points and ends that both go upward, matching the behavior of a quartic function with a positive leading coefficient. It’s the only one that fits both the number of turning points and the same-direction end behavior.
- Graph D: While it appears more complex, it has too many turns for a quartic function—likely representing a higher-degree polynomial, such as degree 5 or more. It doesn’t match the behavior expected of a degree-4 polynomial.
Thus, Graph C is the only one consistent with a quartic function’s characteristics, making it the correct answer.