Three students have different demands for doughnuts. Andres’ demand is given by Q = 5P; Carlene’s demand is given by Q = 6 – 2P; Cooper’s demand is given by Q = 4 – 0.5P. a. The market demand curve for doughnuts is OQ = 15 – 3.5P b. Using the students’ demand functions and the market demand function, graph the demand curve for doughnuts. Pay special attention to any kinks in the market demand! Price 9 10 11 12 13 14 15 Doughnuts
The Correct Answer and Explanation is:
Correct Answer:
a. ✅ Q = 15 – 3.5P
Explanation:
To derive the market demand curve, we sum the individual demand curves of each student horizontally—that is, we add up the quantities demanded by André, Carlene, and Cooper at each price level.
Step 1: Individual Demand Functions
- André:
QA=5−PQ_A = 5 – PQA=5−P
Valid for 0≤P≤50 \leq P \leq 50≤P≤5
He demands 0 when price hits 5 or more. - Carlene:
QC=6−2PQ_C = 6 – 2PQC=6−2P
Valid for 0≤P≤30 \leq P \leq 30≤P≤3
She demands 0 when price hits 3 or more. - Cooper:
QCo=4−0.5PQ_{Co} = 4 – 0.5PQCo=4−0.5P
Valid for 0≤P≤80 \leq P \leq 80≤P≤8
He demands 0 when price hits 8 or more.
Step 2: Market Demand at Different Prices
Add the individual demands to get the total market demand QMQ_MQM. For prices from 0 up to 3, all three demanders are active:
- When P≤3P \leq 3P≤3: QM=(5−P)+(6−2P)+(4−0.5P)=15−3.5PQ_M = (5 – P) + (6 – 2P) + (4 – 0.5P) = 15 – 3.5PQM=(5−P)+(6−2P)+(4−0.5P)=15−3.5P
- This is the correct market demand equation when all three are demanding.
Step 3: Kinks in the Demand Curve
Each consumer exits the market (i.e., demands 0) at their maximum price:
- Carlene stops buying at P=3P = 3P=3
- André stops at P=5P = 5P=5
- Cooper stops at P=8P = 8P=8
These points create kinks in the market demand curve as the slope changes when each consumer drops out.
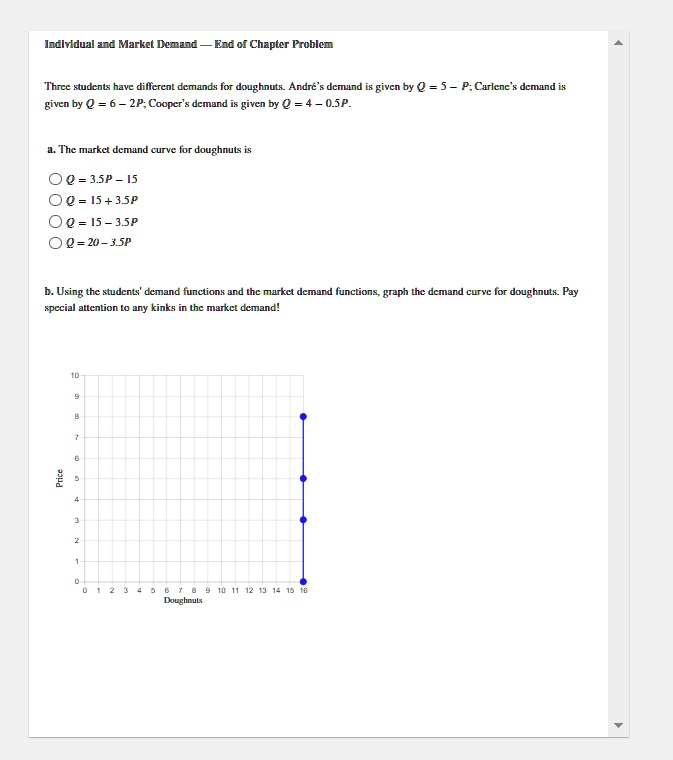
Step 4: Interpreting the Graph
The graph in the image appears incorrect, showing a vertical line at 15 doughnuts across multiple prices, which doesn’t represent the derived demand function Q=15−3.5PQ = 15 – 3.5PQ=15−3.5P. A correct graph should show a downward-sloping, piecewise-linear curve with kinks at prices 3, 5, and 8 due to changing numbers of active consumers.
Conclusion:
The correct market demand curve is: Q=15−3.5P(for P≤3)Q = 15 – 3.5P \quad \text{(for } P \leq 3)Q=15−3.5P(for P≤3)
And the overall market demand is piecewise, with changing slopes after each individual exits the market.
