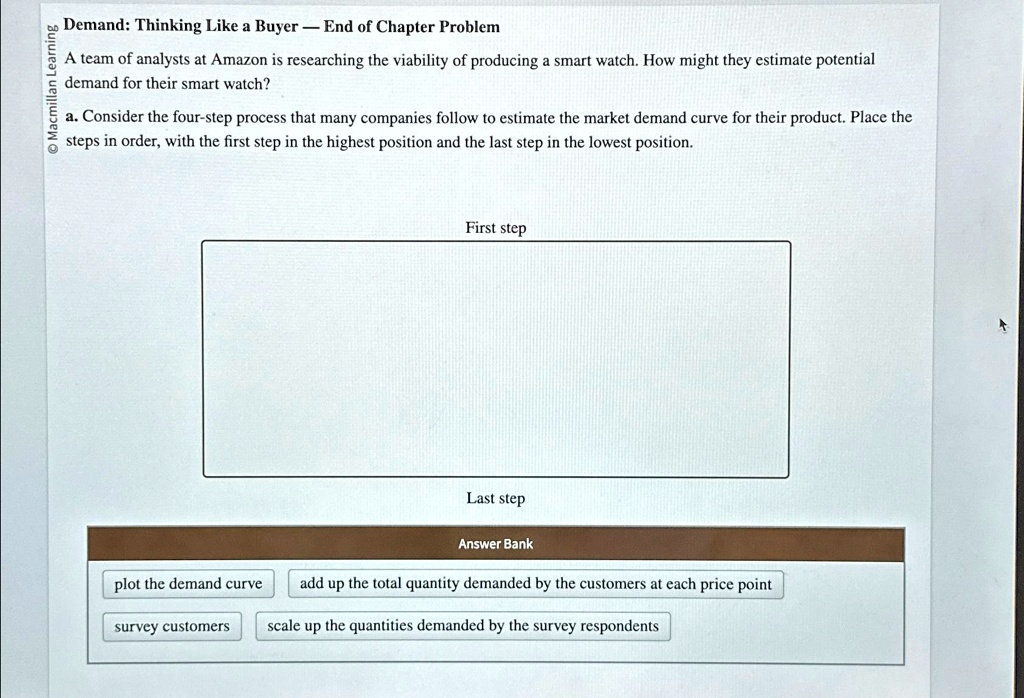
Macmillan Learning Demand: Thinking Like a Buyer — End of Chapter Problem A team of analysts at Amazon is researching the viability of producing a smart watch. How might they estimate potential demand for their smart watch? a. Consider the four-step process that many companies follow to estimate the market demand curve for their product. Place the steps in order, with the first step in the highest position and the last step in the lowest position. First step Last step Answer Bank plot the demand curve add up the total quantity demanded by the customers at each price point survey customers scale up the quantities demanded by the survey respondents
The Correct Answer and Explanation is:
Correct Order of Steps:
- Survey customers
- Scale up the quantities demanded by the survey respondents
- Add up the total quantity demanded by the customers at each price point
- Plot the demand curve
Explanation
To estimate potential demand for a new product like a smart watch, companies typically follow a structured four-step process to build a market demand curve. This process helps analysts understand how many units consumers would purchase at different price points.
Step 1: Survey Customers
The first step involves gathering primary data through customer surveys. Analysts ask a representative sample of potential customers how much of the product they would buy at various prices. This data reveals individual demand behaviors and how sensitive customers are to changes in price.
Step 2: Scale Up the Quantities Demanded by the Survey Respondents
Next, the company needs to take the survey data and scale it to represent the broader market. Since surveys only reflect a small group, analysts extrapolate the results to estimate how the entire target population would behave. For instance, if 100 survey participants represent 1 million consumers, their responses are proportionally scaled up.
Step 3: Add Up the Total Quantity Demanded by the Customers at Each Price Point
After scaling, analysts compile the data to determine the total quantity demanded across different prices. This involves summing up all the scaled quantities consumers are willing to buy at each price point. The goal is to aggregate individual demands into one total market demand at each price.
Step 4: Plot the Demand Curve
Finally, the aggregated data is used to plot the demand curve. This curve graphically represents the relationship between price and quantity demanded. It typically slopes downward, illustrating that as price decreases, demand increases. This curve becomes a crucial tool for decision-making in pricing, production, and marketing strategies.
By following this structured process, Amazon’s analysts can make data-driven predictions about the potential market size and pricing strategy for their smart watch.