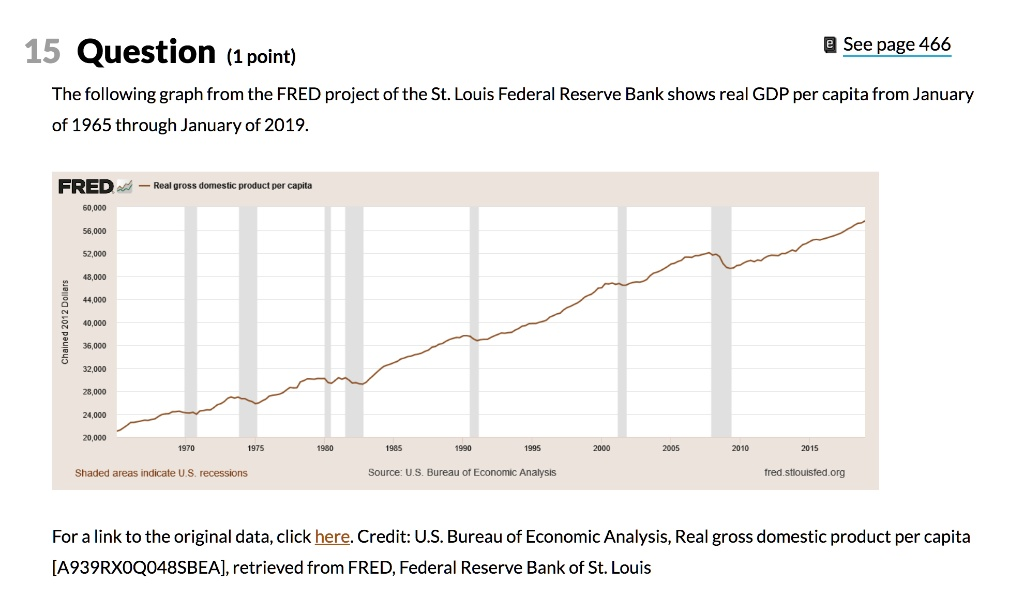
The following graph from the FRED project of the St. Louis Federal Reserve Bank shows real GDP per capita from January of 1965 through January of 2019. FRED Real gross domestic product per capita 60,000 56,000 52,000 Chained 2012 Dollars 48,000 44,000 40,000 36,000 32,000 28,000 24,000 20,000 1970 Shaded areas indicate U.S. recessions 1975 1980 1985 1990 1995 2000 2005 2010 2015 Source: U.S. Bureau of Economic Analysis fred.stlouisfed.org For a link to the original data, click here. Credit: U.S. Bureau of Economic Analysis, Real gross domestic product per capita [A939RX0Q048SBEA], retrieved from FRED, Federal Reserve Bank of St. Louis
The Correct Answer and Explanation is:
Correct Answer:
The graph shows a steady upward trend in real GDP per capita in the United States from 1965 through early 2019, measured in chained 2012 dollars. Despite several recessions, indicated by the shaded areas, real GDP per capita has generally increased over time, rising from around $20,000 in 1965 to over $56,000 in 2019.
Explanation
Real GDP per capita is a crucial indicator of a country’s standard of living, as it measures the average economic output per person, adjusted for inflation. The graph provided by the Federal Reserve Bank of St. Louis shows this indicator from 1965 to 2019, in chained 2012 dollars, which means that the values are adjusted for inflation and reflect constant purchasing power over time.
From the graph, we observe a clear long-term upward trend in real GDP per capita, increasing from approximately $20,000 in 1965 to more than $56,000 by 2019. This trend illustrates significant economic growth in the United States over more than five decades. Such growth can be attributed to several factors, including technological innovation, capital accumulation, improved education and productivity, and the expansion of global trade.
However, the graph also shows several shaded areas representing periods of recession, during which the real GDP per capita either stagnated or declined slightly. For example, recessions in the early 1980s, early 1990s, early 2000s, and the Great Recession of 2007–2009 temporarily interrupted the growth trajectory. These downturns were caused by factors such as oil shocks, financial crises, and housing market collapses. Despite these interruptions, the economy demonstrated resilience and returned to its growth path each time.
The long-run growth in real GDP per capita indicates rising average incomes and, typically, improving living standards. However, it’s important to note that real GDP per capita does not capture income inequality or the distribution of economic gains across different population groups. Still, the overall trend underscores the capacity of the U.S. economy to grow consistently over time, even in the face of cyclical downturns.