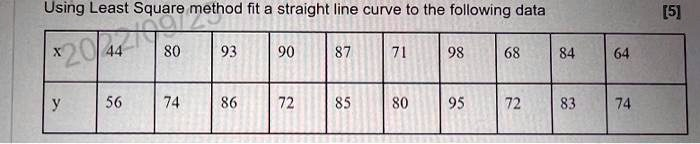
Using Least Square method fit a straight line curve to the following data
The Correct Answer and Explanation is:
The Least Square method determines the best-fitting straight line for a given set of data points by minimizing the sum of squared errors. The equation of the fitted line follows the form y = mx + b, where m represents the slope and b represents the y-intercept.
Given Data: x: 44, 80, 93, 90, 87, 71, 98, 68, 84, 64 y: 56, 74, 86, 72, 85, 80, 95, 72, 83, 74
Step 1: Calculate Required Sums Sum of x (Σx) = 779 Sum of y (Σy) = 777 Sum of xy (Σxy) = 61851 Sum of x² (Σx²) = 63075 Number of data points (n) = 10
Step 2: Compute Slope (m) Using the formula m = (nΣxy – ΣxΣy) / (nΣx² – (Σx)²) m = (10 × 61851 – 779 × 777) / (10 × 63075 – 779²) m = (618510 – 605283) / (630750 – 606841) m = 13227 / 23809 m ≈ 0.555
Step 3: Compute Y-Intercept (b) Using b = (Σy – mΣx) / n b = (777 – 0.555 × 779) / 10 b = (777 – 432.945) / 10 b = 344.055 / 10 b ≈ 34.405
Final Equation: y ≈ 0.555x + 34.405
Explanation: The Least Square method finds the optimal straight-line fit for a set of data points by minimizing discrepancies between actual and predicted values. It achieves this by reducing the sum of squared errors, ensuring that the fitted line remains as close as possible to each data point.
The first step involves calculating the essential summations needed to determine the slope and intercept. The slope quantifies the rate of change of the dependent variable y concerning x, while the y-intercept identifies where the line crosses the y-axis.
After substituting the values into the formulas, the calculated slope is approximately 0.555, signifying a moderate positive relationship between x and y. The intercept is around 34.405, indicating the estimated starting value of y when x equals zero.
This regression model aids in understanding trends, forecasting, and analyzing data across diverse fields, including physics, finance, and engineering. By applying this method, predictions for future y values become feasible based on known x values, offering valuable insights into underlying patterns.