What is the x-intercept of the function graphed below? A. (4,0) B. (0,4) C. (0,-8) D. (-8,0)
The Correct Answer and Explanation is:
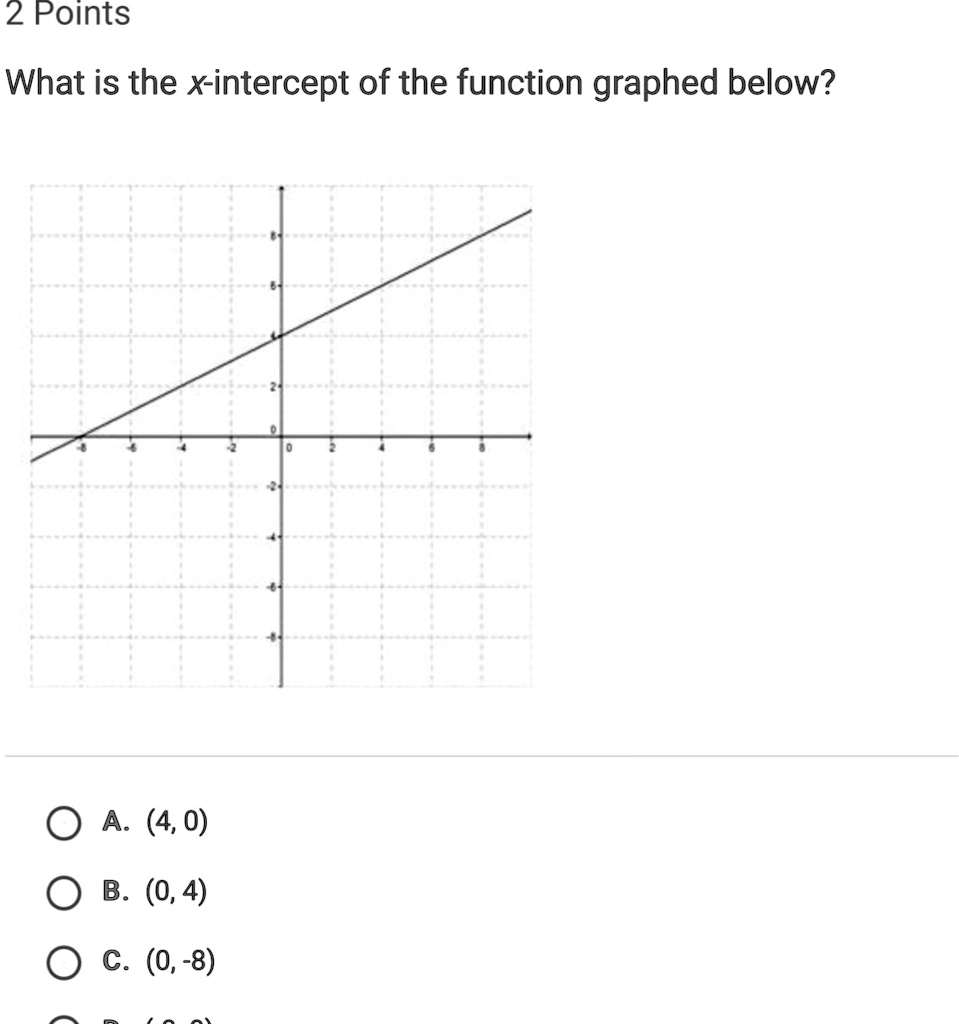
D. (-8, 0)
The x-intercept of a function is the point where its graph crosses the horizontal x-axis. A fundamental property of any point on the x-axis is that its y-coordinate is always zero. Therefore, we are looking for a point on the graphed line that has coordinates in the format (x, 0).
To find the x-intercept from the provided graph, you must locate the horizontal axis, which is the x-axis, and then identify the exact spot where the sloped line intersects it. The graph’s axes are scaled where each major grid line represents two units. If you look at the x-axis, you can see the labels -8, -6, -4, -2, 0, 2, 4, 6, and 8.
By tracing the graphed line, we can see that it crosses the x-axis precisely at the mark labeled -8. At this specific point of intersection, the value on the x-axis is -8, and since the point lies on the x-axis, its corresponding y-value is 0. This gives us the coordinate pair (-8, 0) for the x-intercept.
Now, let’s evaluate the given multiple choice options:
- A. (4, 0): This point lies on the x-axis at x=4, but the graphed line does not pass through it.
- B. (0, 4): This is the y-intercept, not the x-intercept. It is the point where the line crosses the vertical y-axis.
- C. (0, -8): This is a point on the y-axis at y=-8, which the line does not pass through.
- D. (-8, 0): This point correctly identifies the location on the x-axis where the function’s graph crosses. The x-coordinate is -8 and the y-coordinate is 0.
Therefore, the correct x-intercept of the function graphed is (-8, 0)