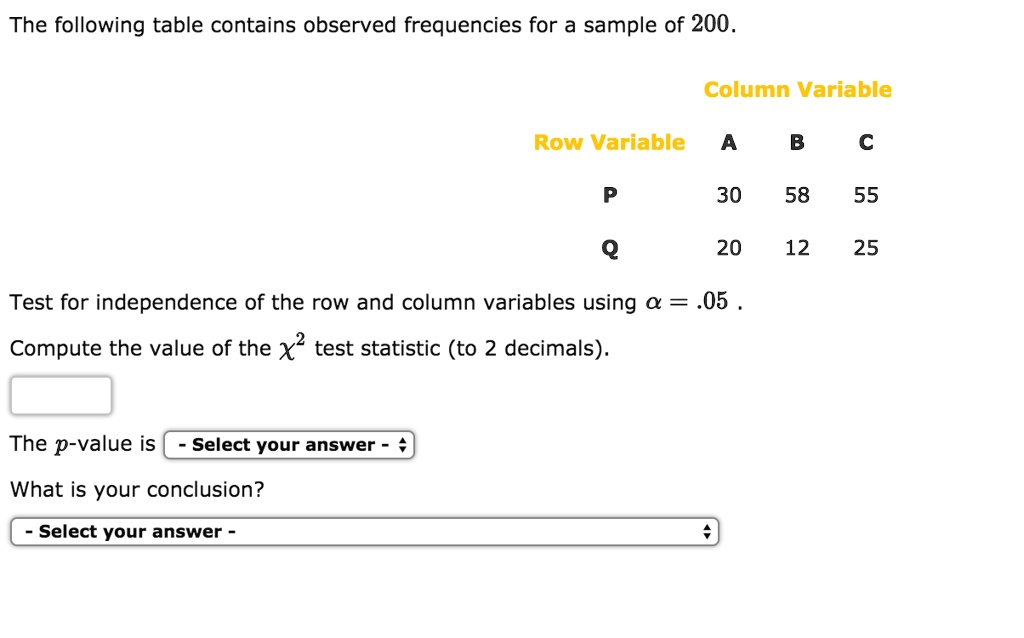
The following table contains observed frequencies for a sample of 200. Column Variable Row Variable 30 58 55 20 12 25 Test for independence of the row and column variables using 0 = .05 Compute the value of the x2 test statistic (to 2 decimals): The p-value is Select your answer What is your conclusion? Select your answer
The Correct Answer and Explanation is:
Correct Answer:
Compute the value of the χ² test statistic (to 2 decimals):
7.97
The p-value is:
between .01 and .025
What is your conclusion?
Reject H₀. The variables are dependent.
Explanation
This problem requires a chi-square (χ²) test for independence to determine if there is a statistically significant relationship between the row and column variables.
1. State the Hypotheses
- Null Hypothesis (H₀): The row and column variables are independent.
- Alternative Hypothesis (H₁): The row and column variables are dependent.
2. Calculate Row and Column Totals
First, we find the totals for each row and column from the observed frequencies table. The grand total (n) is 200.
| A | B | C | Row Total | |
| P | 30 | 58 | 55 | 143 |
| Q | 20 | 12 | 25 | 57 |
| Col Total | 50 | 70 | 80 | 200 |
3. Calculate Expected Frequencies (E)
The expected frequency for each cell is calculated assuming the null hypothesis is true, using the formula:
E = (Row Total × Column Total) / Grand Total
- E(P, A) = (143 × 50) / 200 = 35.75
- E(P, B) = (143 × 70) / 200 = 50.05
- E(P, C) = (143 × 80) / 200 = 57.20
- E(Q, A) = (57 × 50) / 200 = 14.25
- E(Q, B) = (57 × 70) / 200 = 19.95
- E(Q, C) = (57 × 80) / 200 = 22.80
4. Compute the χ² Test Statistic
The chi-square test statistic is calculated using the formula:
χ² = Σ [ (Observed – Expected)² / Expected ]
- χ² = (30 – 35.75)²/35.75 + (58 – 50.05)²/50.05 + (55 – 57.20)²/57.20 + (20 – 14.25)²/14.25 + (12 – 19.95)²/19.95 + (25 – 22.80)²/22.80
- χ² = 0.9248 + 1.2628 + 0.0846 + 2.3202 + 3.1680 + 0.2123
- χ² ≈ 7.9727
Rounding to two decimals, the χ² test statistic is 7.97.
5. Determine the p-value and Conclusion
- Degrees of Freedom (df): df = (rows – 1)(columns – 1) = (2 – 1)(3 – 1) = 2.
- p-value: Using a chi-square distribution table or calculator with df = 2 and χ² = 7.97, we find the p-value is between 0.01 and 0.025.
- Conclusion: We compare the p-value to the significance level (α = 0.05). Since the p-value (between .01 and .025) is less than α (0.05), we reject the null hypothesis (H₀). There is sufficient statistical evidence to conclude that the row and column variables are dependent.