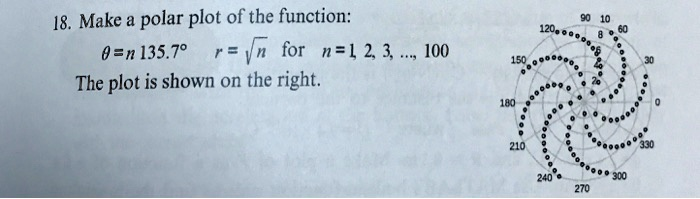
- Make a polar plot of the function: for
The plot is shown on the right.
The Correct Answer and Explanation is:
Correct Answer:
The function is defined by the following equations for the polar coordinates (r, θ):
θ = n * 135.7°
r = √n
for n = 1, 2, 3, …, 100
Explanation
This problem illustrates how to generate a pattern, known as a phyllotactic or Fermat’s spiral, by plotting a series of points in a polar coordinate system. A polar system defines a point not by its x and y coordinates, but by its distance from the origin (radius, r) and its angle from a reference axis (θ).
The provided function calculates the coordinates for 100 distinct points, corresponding to the integer values of n from 1 to 100. For each value of n, a unique pair of (r, θ) coordinates is generated.
- The Radius r = √n: This equation determines the point’s distance from the center of the plot. As n increases, the radius r also increases, causing the points to move progressively farther away from the origin. However, because it’s a square root function, the distance between consecutive points decreases as n gets larger, making the spiral appear denser at its outer edges.
- The Angle θ = n * 135.7°: This equation sets the angle for each point. For every new point (n), the angle is increased by a constant amount of 135.7°. This fixed angular increment is called the divergence angle.
The combination of these two rules creates the striking spiral pattern. As points are plotted, the angle “wraps around” the 360° circle. For example, the point for n=3 is at an angle of 3 * 135.7° = 407.1°, which is equivalent to 407.1° – 360° = 47.1°. Because 135.7° is an irrational-like fraction of 360°, the points never perfectly align, instead forming a set of interlocking spiral arms. This pattern is famously seen in nature in the arrangement of seeds in a sunflower, petals on a flower, and scales on a pinecone, as it represents a highly efficient way to pack elements.