On the grid, draw the graph of y = 3 – 2x for values of x from -2 to 2.
The Correct Answer and Explanation is:
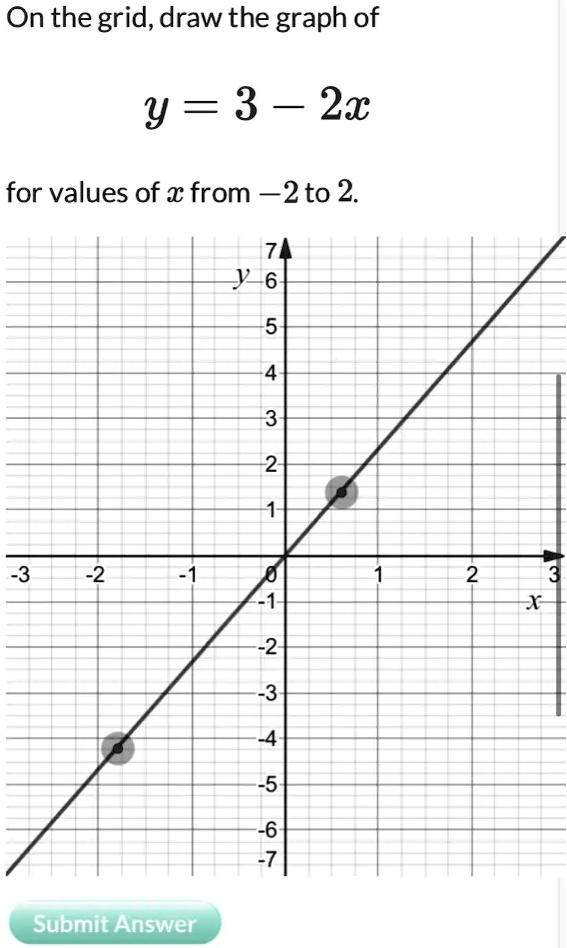
The graph provided in the image is an incorrect representation of the equation y = 3 – 2x. The line shown in the image passes through the origin (0,0) and has a positive slope, while the correct graph for the equation y = 3 – 2x should have a y-intercept at 3 and a negative slope.
To accurately draw the graph of this linear equation, we first need to identify coordinates for several points that lie on the line. The problem asks for the graph for values of x from -2 to 2. We can create a table of values by substituting different x-values within this range into the equation to find their corresponding y-values.
Let’s calculate the coordinates for the endpoints and a few points in between:
- When x = -2:
y = 3 – 2(-2)
y = 3 + 4
y = 7
This gives us the point (-2, 7). - When x = 0:
y = 3 – 2(0)
y = 3 – 0
y = 3
This gives us the point (0, 3), which is the y-intercept. - When x = 1:
y = 3 – 2(1)
y = 3 – 2
y = 1
This gives us the point (1, 1). - When x = 2:
y = 3 – 2(2)
y = 3 – 4
y = -1
This gives us the point (2, -1).
The correct procedure is to plot these calculated points on the grid. You would mark a point at (-2, 7), another at (0, 3), and one at (2, -1). Once these points are plotted, you connect them with a straight line. Since the question specifies the range for x from -2 to 2, the graph should be a line segment that starts at the point (-2, 7) and ends at the point (2, -1). The resulting line will slope downwards from left to right, correctly representing the negative slope of -2 in the equation