Student Desmos Com Introduction: Kalie Bounan 6 to 8 Next Graphing Points in a Piecewise Function: 440 220
The Correct Answer and Explanation is:
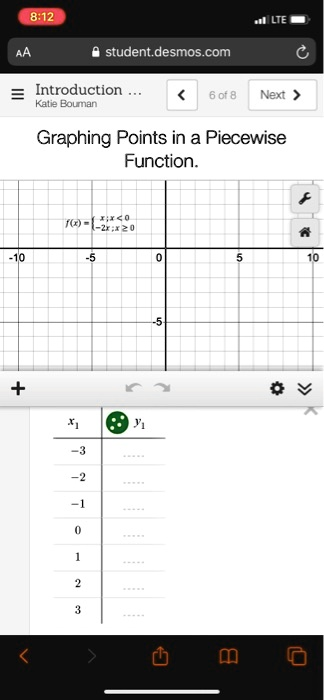
Here are the completed values for the table based on the given piecewise function.
x₁ y₁
-3 -3
-2 -2
-1 -1
0 0
1 -2
2 -4
3 -6
Explanation
The problem requires us to find the output values (y₁) for a set of input values (x₁) using a given piecewise function. A piecewise function is a function defined by multiple sub-functions, where each sub-function applies to a specific interval of the domain.
The function provided is:
f(x) = { x, if x < 0
{ -2x, if x ≥ 0
To solve this, we must evaluate each x-value from the table individually. The key is to first determine which condition the x-value satisfies, either x < 0 or x ≥ 0, and then apply the corresponding formula to find the y-value.
For the negative x-values (-3, -2, and -1), the condition x < 0 is true. Therefore, we use the first formula, f(x) = x.
When x = -3, f(-3) = -3.
When x = -2, f(-2) = -2.
When x = -1, f(-1) = -1.
For the non-negative x-values (0, 1, 2, and 3), the condition x ≥ 0 is true. For these inputs, we must use the second formula, f(x) = -2x.
When x = 0, f(0) = -2 * 0 = 0.
When x = 1, f(1) = -2 * 1 = -2.
When x = 2, f(2) = -2 * 2 = -4.
When x = 3, f(3) = -2 * 3 = -6.
By following this process for each input, we can correctly complete the table. Each (x, y) pair represents a point that lies on the graph of this piecewise function.