Student Desmos Com Introduction: Kalie Bounan 6 to 8 Next Graphing Points in a Piecewise Function: 440 220
The Correct Answer and Explanation is:
Based on the provided image, here are the correct y-values for the table.
Correct Answer
| x₁ | y₁ |
| -3 | -3 |
| -2 | -2 |
| -1 | -1 |
| 0 | 0 |
| 1 | -2 |
| 2 | -4 |
| 3 | -6 |
Explanation
The problem asks to find the corresponding y-values for a given set of x-values using a piecewise function. A piecewise function is a function defined by multiple rules, where each rule applies to a specific part of the domain (the input x-values).
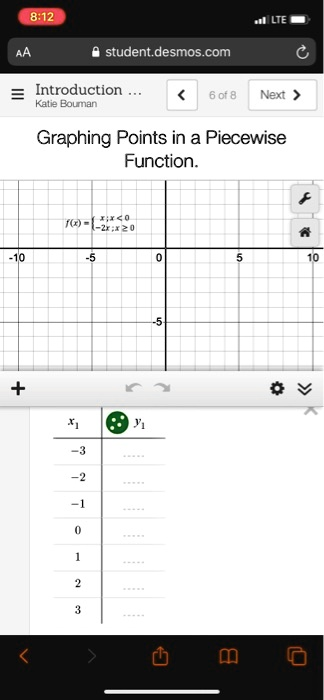
The function provided is:
f(x) = { x, for x < 0
{ -2x, for x ≥ 0
To solve this, we must evaluate each x-value from the table to determine which of the two conditions it meets. Once we identify the correct condition, we apply its corresponding mathematical rule to find the y-value.
For the negative x-values (-3, -2, and -1):
Each of these numbers is less than 0, so we use the first rule, f(x) = x.
- For x = -3, f(-3) = -3.
- For x = -2, f(-2) = -2.
- For x = -1, f(-1) = -1.
In this interval, the output value is identical to the input value.
For the non-negative x-values (0, 1, 2, and 3):
Each of these numbers is greater than or equal to 0, so we use the second rule, f(x) = -2x.
- For x = 0, f(0) = -2 * 0 = 0.
- For x = 1, f(1) = -2 * 1 = -2.
- For x = 2, f(2) = -2 * 2 = -4.
- For x = 3, f(3) = -2 * 3 = -6.
For this interval, the output value is the input value multiplied by negative two.
By applying the correct rule based on the input x-value, we can accurately complete the table. These calculated points, such as (-3, -3), (0, 0), and (2, -4), can then be plotted on the coordinate plane to begin graphing the two distinct pieces of the function.