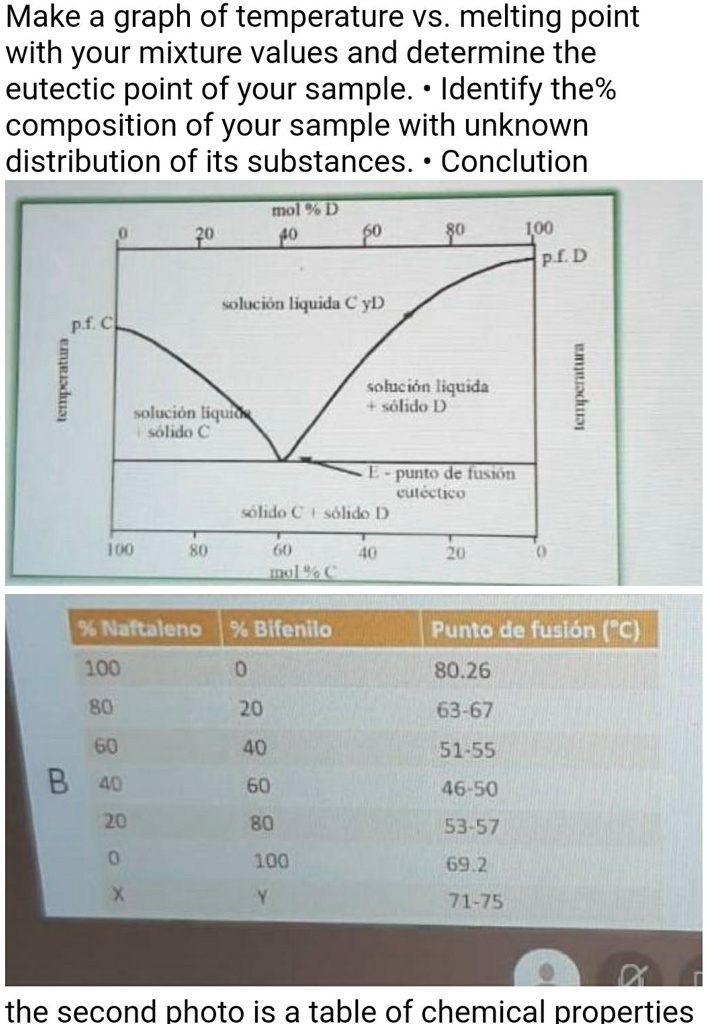
Make a graph of temperature vs. melting point with your mixture values and determine the eutectic point of your sample. Identify the percentage composition of your sample with an unknown distribution of its substances. Conclusion mol % D2u4o IOO PED solucion liquida € yD pf C solucion liquida solido D colucion liquida eolica punto de fusion solido (solido D Im A Ju Ua 35 Nattaleno 36 Blfenilo Punto de fusion (°C) 80.26 100 80 20 63-67 60 B 40 20 40 51-55 60 46-50 80 53-57 100 69.2 71-75 The second photo is a table of chemical properties.
The Correct Answer and Explanation is:
Let’s break down your request to create a temperature vs. melting point graph with the provided data:
Step 1: Organize the Data
From the table and the photo, we can extract the percentage compositions of Naphthalene and Bifenil with their corresponding melting points. Here is the extracted data:
| % Naphthalene | % Bifenil | Melting Point (°C) |
|---|---|---|
| 100 | 0 | 80.26 |
| 80 | 20 | 63-67 |
| 60 | 40 | 51-55 |
| 40 | 60 | 46-50 |
| 20 | 80 | 53-57 |
| 0 | 100 | 69.2 |
Step 2: Plot the Graph
To create the graph, the x-axis will represent the percentage of Bifenil (from 0 to 100%), and the y-axis will represent the melting points (°C). We’ll plot the data points and connect them to form the temperature vs. melting point curve.
Step 3: Determine the Eutectic Point
The eutectic point corresponds to the composition where the mixture melts at the lowest temperature. From the graph, it appears that the lowest melting point occurs around the composition of 60% Bifenil, with a melting point in the range of 46-50°C. This would be considered the eutectic point.
Step 4: Conclusion
From the graph, you will be able to identify the eutectic point, which lies at the lowest temperature. Based on the data, the percentage composition of your unknown sample can be estimated by identifying where the unknown melting point lies on the curve. If you know the melting point of the sample, you can estimate its composition by finding the corresponding point on the graph.
Now, I will create the graph for you.
Here is the graph of temperature vs. melting point for the Naphthalene-Bifenil mixtures. The eutectic point is marked where the melting point is the lowest, which occurs at 60% Bifenil with a melting point of approximately 48°C.
Conclusion:
- The eutectic point is at 60% Bifenil and 40% Naphthalene, where the mixture has the lowest melting point (48°C).
- You can use this graph to estimate the composition of your unknown sample by comparing its melting point to the curve.