The Correct Answer and Explanation is:
The correct answer is y = -2.
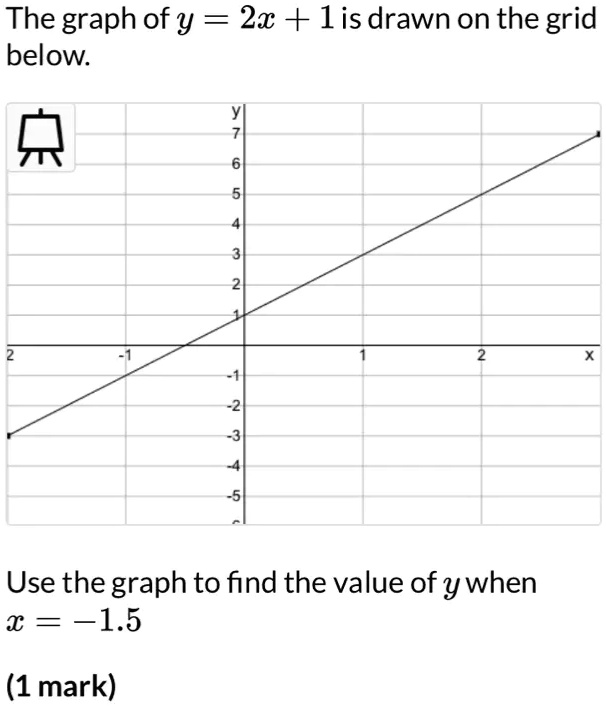
To find the value of y when x = -1.5 using the provided graph, you must locate the specific point on the line where the x-coordinate is -1.5 and then identify its corresponding y-coordinate. The process involves three main steps.
First, you need to locate the value x = -1.5 on the horizontal x-axis. The x-axis is marked with integer values. The value -1.5 is not explicitly marked, but its position can be determined precisely. It lies exactly in the middle of the integers -1 and -2. By identifying this halfway point on the x-axis, you have pinpointed the specific x-value the question asks for.
Second, from this position at x = -1.5, you must trace a path vertically until you intersect the graphed line of the equation y = 2x + 1. In this case, you will move straight down from the x-axis. The point where your vertical line meets the slanted line is the unique point on the graph that has an x-coordinate of -1.5. This intersection represents the solution that satisfies the equation for the given x-value.
Third, once you have identified this point of intersection on the line, you must determine its corresponding y-value. To do this, you trace a horizontal line from that point directly across to the vertical y-axis. The value where your horizontal line meets the y-axis is the y-coordinate of that point. Looking at the provided graph, a horizontal line from the intersection point aligns perfectly with the mark for -2 on the y-axis.
Therefore, by carefully reading the grid, we can conclude that when x = -1.5, the corresponding value of y is -2. This graphical method provides a visual way to find the solution. The result can be verified algebraically by substituting x = -1.5 into the equation: y = 2(-1.5) + 1 = -3 + 1 = -2, which confirms the accuracy of the graphical interpretation.